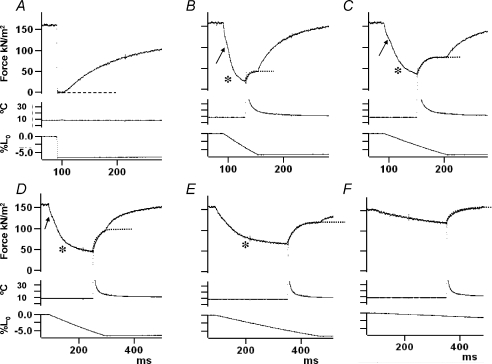
Figure 1. Tension responses to ramp shortening and to T-jump during shortening.
The fibre was maximally Ca-activated at ∼8°C and during the isometric tension plateau (top trace), a ramp shortening of ∼7%L0 was applied (bottom trace); middle trace is the temperature of the trough solution monitored close to the fibre. A, a rapid ramp shortening (>3 L0 s−1), with no T-jump, leads to unloaded shortening, fall in tension and subsequent tension re-development; the dashed line denotes zero tension. B–F, tension responses to ramp shortening at five different velocities, decreasing from B (∼1 L0 s−1) to F (0.04 L0 s−1). Note that frames D, E and F are displayed on a slower time scale. An asterisk denotes the gradual decrease of tension slope (the P2 transition) towards a shortening steady tension. As first described in frog fibres by Ford et al. (1977), an initial inflection (arrow, referred to as the P1 transition) is seen in a tension decline during ramp shortening and its amplitude is larger at the higher velocities (see Roots et al. 2007, in rat fibres). In each case, a T-jump of ∼3°C was induced by a laser pulse during the subsequent steady shortening after the P2 transition; the middle trace is the thermocouple output where the initial overshoot and slow decay are due to direct laser light absorption by the thermocouple (see Goldman et al. 1987; Ranatunga, 1996). Note that, as the velocity is increased from F to B, the tension rise after T-jump (see the superimposed dotted line) becomes faster and its amplitude increases and then decreases.

