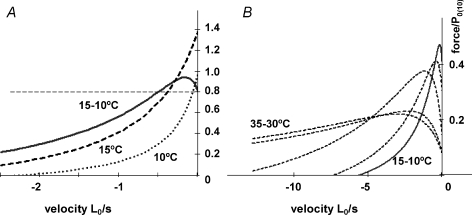
Figure 6. Force–shortening velocity curves at different temperatures from steady state experiments.
A, the steady-state force versus shortening velocity curves for intact rat fast (extensor digitorum longus) muscle at 10°C (dotted curve) and 15°C (dashed curve). The curves were constructed using the mean Vmax and a/P0 data given in Table 1 of Ranatunga (1984) in which the isotonic release method was used to determine the force–shortening velocity relations. For comparison with Fig. 5A and B, force is normalised to P0 at 10°C (on the basis of the temperature dependence of the tetanic force of rat fast muscle (Coupland & Ranatunga, 2003). The continuous curve is the tension difference between 15°C and 10°C; for clarity in presentation, 2 × tension difference is plotted, where the horizontal dashed line is the isometric force difference The data from steady state experiments show the basic features of the T-jump amplitude data in Fig. 5A and B, particularly, that the force increment for a standard 5°C increase of temperature is larger than in the isometric state at low velocities (<0.5 L0 s−1), but decreases below that of isometric at higher velocities. B, 5°C difference force versus shortening velocity curves for a range of temperatures from the same study. Note that the biphasic temperature sensitivity of force in shortening muscle is evident at all temperatures, although the curves are shifted to higher velocities at the higher temperatures (e.g. 30–35°C). Since force in lengthening muscle was insensitive to T-jump (Ranatunga et al. 2007), the difference–tension curves would remain near zero on the positive side of the abscissa.

