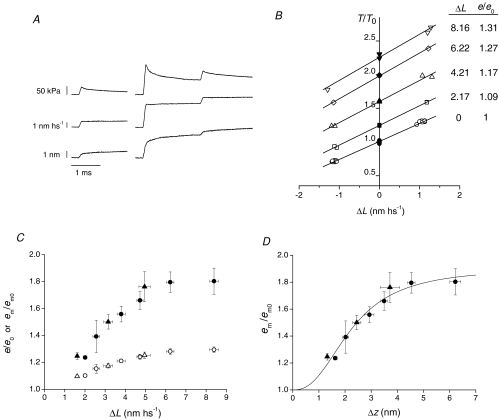
Figure 6. Stiffness measurements at 2 ms after the stretch.
A, force response (upper trace) to length steps (middle trace) and average axial distortion of motors (Δz, lower trace). Test steps of amplitude ±1 nm hs−1 were imposed at T0 (left column) and at 2 ms after the conditioning stretch (right column). B, T1 points for the test steps (open symbols) and Ti points (filled symbols, the force just before the test step) for T0 (circles) and four different conditioning stretches of size ΔL, identified by the symbols as indicated in the table in the inset. e/e0, reported in the table, are the slopes of the linear regressions (continuous lines) fitted to the T1–Ti points, relative to that at T0. Data from one fibre. C, e/e0 (open circles) and em/em0 (filled circles) obtained with the test steps at 2 ms after the stretch versusΔL (mean ±s.e.m., 9 fibres). Open and filled triangles are the respective values obtained at 2 ms after the stretch with 4 kHz length oscillations (from Fig. 5). D, em/em0versusΔz at 2 ms after the stretch (same data as filled symbols in C). The continuous line is the data fit of the equation: em/em0=A (Δzn)/(kn+Δzn) + 1.

