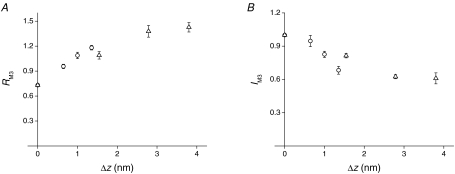
Figure 8. Dependence of RM3 and IM3 on motor distortion.
A, RM3 values from Brunello et al. (2007) at the end of the stretch (circles) and at 2 ms after the stretch (triangles) plotted versusΔz values calculated using Cf= 3.7 nm T0−1. B, IM3 values from Brunello et al. (2007) plotted versusΔz. Symbols as in A.

