

Abstract
Background
Avoiding hypoglycemia while keeping glucose within the narrow normoglycemic range (70–120 mg/dl) is a major challenge for patients with type 1 diabetes. Continuous glucose monitors can provide hypoglycemic alarms when the measured glucose decreases below a threshold. However, a better approach is to provide an early alarm that predicts a hypoglycemic episode before it occurs, allowing enough time for the patient to take the necessary precaution to avoid hypoglycemia.
Methods
We have previously proposed subject-specific recursive models for the prediction of future glucose concentrations and evaluated their prediction performance. In this work, our objective was to evaluate this algorithm further to predict hypoglycemia and provide early hypoglycemic alarms. Three different methods were proposed for alarm decision, where (A) absolute predicted glucose values, (B) cumulative-sum (CUSUM) control chart, and (C) exponentially weighted moving-average (EWMA) control chart were used. Each method was validated using data from the Diabetes Research in Children Network, which consist of measurements from a continuous glucose sensor during an insulin-induced hypoglycemia. Reference serum glucose measurements were used to determine the sensitivity to predict hypoglycemia and the false alarm rate.
Results
With the hypoglycemic threshold set to 60 mg/dl, sensitivity of 89, 87.5, and 89% and specificity of 67, 74, and 78% were reported for methods A, B, and C, respectively. Mean values for time to detection were 30 ± 5.51 (A), 25.8 ± 6.46 (B), and 27.7 ± 5.32 (C) minutes.
Conclusions
Compared to the absolute value method, both CUSUM and EWMA methods behaved more conservatively before raising an alarm (reduced time to detection), which significantly decreased the false alarm rate and increased the specificity.
Keywords: CUSUM control chart, early hypoglycemic alarms, EWMA control chart, glucose predicting models, time-series methods
Introduction
The Diabetes Control and Complications Trial1 and the United Kingdom Prospective Diabetes Study2 have demonstrated that intensive insulin therapy is significantly better at normalizing blood glucose levels of insulin-dependent patients compared to conventional insulin therapy. However, it comes with a toll of a threefold increase in severe hypoglycemic incidences reported.1 Avoiding hypoglycemia, while keeping glucose within the narrow normoglycemic range (70–120 mg/dl), is a major challenge for patients with type 1 diabetes.
Recent technological advances in continuous glucose monitoring (CGM) provide detailed insight into a subject's glucose profile during the day. Frequently measured glucose data enable development of more reliable data-driven models for predicting a subject's future glucose concentrations.3–10 Such predicted values can then be used to provide early hypoglycemic alarms.
Many of the CGM devices currently available on the market provide real-time alarms when the measured glucose is below or above a user-specified threshold. However, patients will benefit more from an early alarm that predicts a hypoglycemic/hyperglycemic episode before it occurs, allowing enough time for the patient to take the necessary precaution (e.g., food ingestion or insulin adjustment). Several of the CGM sensors provide such early alarms generally by extrapolating the rate of change of glucose concentration.11–16 The performance of early alarms is highly dependent on the value of the threshold and prediction horizon selected.6 A very high frequency of false alarms is reported especially for predicting hypoglycemia for glucose levels below 60 mg/dl,12–14 which limits their credibility and use by the patients. Therefore, there is a need to improve the sensitivity to predict hypoglycemia (≤60 mg/dl) from CGM data.
In a study by the Diabetes Research in Children Network (DirecNet) group,12 sensitivity of the first commercial CGM device (CGMS™) has been shown to be 36% with a 63% false alarm rate for detection of a glucose level ≤60 mg/dl. The same group demonstrated that only 8 and 24% of truly hypoglycemic incidents were detected during overnight and a hypoglycemia test, respectively, with a real-time GlucoWatch G2 Biographer sensor.13 Combining the threshold alarm with a 20-minute projected alarm improved those sensitivity rates to 77 and 88%. Sensitivity was reported as 79.8% for the FreeStyle Navigator with a 70-mg/dl threshold and a 30-minute prediction time for the projected alarm.15 For the Guardian sensor,16 hypoglycemia alarms detected values of ≤70 mg/dl with a sensitivity of 67%, a specificity of 90%, and a false alarm rate of 47%. With the low alert set at 80 mg/dl, hypoglycemia was detected with 88% sensitivity and 91% specificity for DexCom.17
We have previously proposed a subject-specific recursive algorithm for the prediction of future glucose concentrations.3 The algorithm was based on time-series analysis of continuous glucose sensor data and was validated in terms of glucose predictions and continuous glucose-error grid analysis (CG-EGA).3 The linear model developed was integrated with recursive identification and change detection methods, which enabled dynamical adaptation of the model to inter/intrasubject variability and glycemic disturbances. The model did not require any prior experimental data, off-line tuning for each subject, or disturbance information. Other empirical models proposed in the literature may require additional inputs, such as food intake, physical condition information, or insulin infusion rate.9,18–23
We reported 3.83 ± 1.63% relative absolute deviation and accurate readings of 90% or more with CG-EGA on 14 ambulatory patients with diabetes when predicting 30 minutes into the future.3 This work further evaluated the algorithm to predict hypoglycemia and provide early hypoglycemic alarms. Three different methods were proposed for alarm decision, where (A) absolute predicted glucose values, (B) a cumulative-sum (CUSUM) control chart, and (C) an exponentially weighted moving-average (EWMA) control chart were used. Sensitivity to predict hypoglycemia and the false alarm rate of each method were evaluated for an alarm threshold of 60 mg/dl and a 30-minute prediction horizon.
Methods
Subject Data
The data set from the DirecNet was used in this work.11–13 The patient population consisted of 54 subjects with type 1 diabetes (age 7–18). Each subject wore a CGM sensor (Continuous Glucose Monitoring System, CGMS™, Medtronic MiniMed, Northridge, CA) during the 24-hour clinical research center admission and underwent an insulin-induced hypoglycemia test (≤55 mg/dl). During the inpatient stay, simultaneous use of a second CGMS sensor was optional. Blood samples were drawn for reference glucose measurements every 60 minutes during the day, every 30 minutes during the night (9 PM–7 AM), and every 5 minutes for up to 1.5 hours during the insulin-induced hypoglycemia test.
Glucose Prediction Algorithm
Details of our subject-specific recursive algorithm for the prediction of future glucose concentrations and its validation in terms of error in predictions are presented elsewhere.3 The same algorithm was also validated for closed-loop automated insulin administration (artificial pancreas),4 where predicted glucose concentrations were used for computing the appropriate insulin infusion rate for the subject. The proposed algorithm is based on time-series analysis of continuous glucose sensor data. This work provides only a brief description of the algorithm.
Using subject's CGM device data, an autoregressive moving-average (ARMA) model was developed:
| (1) |
where k indicates the sampling instant. The ARMA model describes the current glucose measurement yk as a linear function of previous glucose measurements {yk-i} (i=l,…,nA) and residual terms {ek-j} (j=1,..,nC). For known model parameters {ai, cj}, the model can be appended for n steps to compute the n-steps-ahead predicted glucose concentration based on currently available sensor data.3 We found ARMA of order (nA = 2, nC = 1) to provide optimal prediction performance.3 It has only three model parameters to be identified. When there is no additional information, the initial value of each parameter is assigned as zero. At each sampling step, the parameters are identified recursively in order to include the most recent measurement from the CGM sensor. Online identification is achieved with the weighted recursive least-squares (WRLS) method, which has a forgetting factor (0 < λ ≤ 1) that assigns relative weights on past observations for model development.
The WRLS with a constant λ will normally provide sufficient model tracking unless the system deviates from its steady-state operating conditions. However, daily glucose excursions include large transition periods (e.g., after a meal consumption). Therefore, we use a variable λ that takes a small value during transition periods (change detected) and a large value during fasting conditions. The mechanism for varying λ is implemented with a change detection strategy integrated to the WRLS algorithm that monitors the variation in the model parameters. When the algorithm detects a change in parameters, the value of forgetting factor in the WRLS is reduced. A small λ ensures that new information regarding the change in the system dynamics is quickly collected and old information is discarded. The proposed change detection method is described by null and alternative hypotheses given by:
| (2) |
where E(θk) describes the expected value of parameter estimates at kth sampling instant and ΘN is the expected value computed using data until time instant N. To avoid changes due to nonpersistent abnormalities in data, such as sensor noise, the value of λ is not reduced at the first instance of change detection. Instead, consistency of the change for several time steps (window size, NW) is assured first. When a persistent change with the duration of the window size is detected, λ is reduced to a smaller value and ΘN is replaced with its new estimate.
Early Hypoglycemic Alarms
The common approach for an alarm decision is to use the absolute value of the predicted glucose (e.g., 30 minutes into the future). In this case, only when the predicted glucose crosses the assigned threshold (e.g., 60 mg/dl) is an alarm issued. This approach considers only information contained in the last predicted glucose value. This work also investigates the use of control charts (CUSUM and EWMA) to predict “out-of-control” (≤60 mg/dl) glucose concentrations to provide early hypoglycemic alarms. CUSUM and EWMA methods take into consideration the information of the entire sequence of predicted glucose concentrations.
Absolute Predicted Value
The glucose prediction algorithm3 summarized in the previous section is used to predict the n-steps-ahead glucose concentration. When the n-steps-ahead predicted glucose level ŷk + n|k is below the threshold value for hypoglycemia, an alarm is triggered at that sampling time (k).
Cumulative-Sum Control Chart
A one-sided CUSUM control chart can be used to monitor the mean of predicted glucose concentrations and provide early hypoglycemic alarms when the mean crosses the control limit. Because this work focused on hypoglycemia prediction, we considered the one-sided lower CUSUM control chart, which is formed by plotting the quantity
| (3) |
over sampling steps. In Equation (3), μ0 is the target mean value. K is called the reference value and is chosen as halfway between the target μ0 and the out-of-control μ1 mean that we desire to detect quickly:
| (4) |
where Ck− is defined as one-sided lower cumulative deviations from the target mean value μ0 that are greater than K. The center line and the lower control limit (LCL) for the CUSUM chart is 0 and H ≈ 5σ, respectively. If the Ck− exceeds the decision interval H, the predicted glucose levels are considered out of control and therefore an alarm is triggered at that sampling time.
Exponentially Weighted Moving-Average Control Chart
The EWMA control chart is defined by using variable zk:
| (5) |
| (6) |
| (7) |
where zk is plotted versus the sampling time k. In Equation (7), σ is the known or estimated standard deviation, L is the width of control limits, and the constant 0 < λ ≤ 1 assigns geometrically decreasing weights on sensor data. Similar to the CUSUM, if the zk crosses the LCL, the predicted glucose levels are considered out of control and therefore an alarm is triggered at that sampling time.
Results
Using CGMS glucose measurements (CGMS provides data every 5 minutes), the proposed glucose prediction modeling algorithm was utilized to compute a subject's n-steps-ahead glucose concentration (ŷk+n|k). These predicted values were then used in each of the three early hypoglycemic alarm methods: (A) absolute predicted value, (B) CUSUM control chart, and (C) EWMA control chart. Even though the data set consisted of glucose readings over a 24-hour period, the performance of early alarms was evaluated only during the insulin-induced hypoglycemia period when frequent reference blood samples are available (each 5 minutes) for comparison and performance evaluation. A frequent reference glucose sampling period was assigned as 1.5 hours beginning from the start of the insulin-induced hypoglycemia test. However, if this period was extended for any reason, we continued to conduct our early alarm analysis until the sampling rate returned to its usual 1-hour or 30-minute routine.
We set the hypoglycemic threshold as 60 mg/dl and defined a hypoglycemic episode as an event with at least two consecutive (10 minutes or more) reference glucose measurements below or equal to the threshold value. The hypoglycemic event was considered to have ended when reference glucose values rose above 65 mg/dl. An alarm was defined as an event (not as individual time points) that signals that sensor glucose or predicted glucose values have crossed the threshold limit. We considered the combined effect of sensor alarms (triggered when current sensor measurement was ≤60 mg/dl) and early alarms (prediction method anticipates out-of-control glucose levels in the near future).
For each method, an alarm is considered true positive if the alarm is issued up to 45 minutes before a truly hypoglycemic event and is held during the event. However, a false positive alarm (type I error) occurs if the alarm is issued incorrectly during a nonhypoglycemic event or if the alarm is raised too early for a true event (e.g., 46 minutes or more before the hypoglycemic episode). False negative or type II error describes when an alarm is not raised (missed) during a truly hypoglycemic event. True negative is when absence of hypoglycemia is identified correctly with no alarm triggered by the sensor. Sensitivity of a method to predict hypoglycemia is defined as percentage of true alarms among all the hypoglycemic events occurred:
| (8) |
Similarly, specificity is a measure used to correctly identify the absence of hypoglycemic events:
| (9) |
Another performance metric used is time to detection, which is defined as time elapsed between the start of continuous alarming (true alarm event) based on glucose concentration predictions and the start of the hypoglycemic event (see Figure 1).
Figure 1.

Reference (Ref) blood glucose measurements, CGMS sensor data, and 30-minute-ahead predicted glucose levels of a representative subject. Method A triggers an early alarm when the absolute value of the predicted glucose concentration drops below the threshold of 60 mg/dl. Shaded area represents the true positive alarm issued 20 minutes before the hypoglycemic event (time to detection).
For each subject, we analyzed glucose measurements taken during the insulin challenge period in order to identify whether a hypoglycemic event occurred. All sensor glucose data were used by the prediction algorithm, and six-steps-ahead (30-minute prediction horizon) glucose values were predicted for the entire 24-hour period. If sensor data contained a few missing readings, their values were extrapolated linearly, especially during the insulin-induced hypoglycemia period. Alarm methods were also implemented for the entire day, as previously predicted values will have an effect on the current alarm decision. However, for performance evaluation, only alarm decisions during the insulin-induced test period were included (when frequent reference glucose measurements are available).
Figure 1 demonstrates reference blood glucose samples, CGMS sensor data, and 30-minute-ahead predicted glucose values (ŷk+6|k) for representative patient. The ŷk+6|k value is displayed at the current step (k), but actually corresponds with a future sensor glucose value, which will occur at step k + 6. The subject in Figure 1 underwent an insulin-induced hypoglycemia test at 4:15 PM, which lasted for 1.5 hours. Shown also are the hypoglycemic event, the event alarm issued, and the time-to-detection metric for the subject. An event alarm was implemented using method A (absolute predicted value). When a predicted glucose value fell below 60 mg/dl, an alarm was issued. Even though the prediction horizon was set to 30 minutes, time to detection can be longer or shorter (20 minutes for this case).
An event alarm with method B is shown in Figure 2A for the same subject. CUSUM control charts are also provided (Figure 2B). The desired mean value μ0 (65 mg/dl) is set slightly over the hypoglycemic threshold, whereas the out-of-control mean value μ1 [Equation (4)] is assigned equal to the threshold, and the standard deviation σ is assumed to be 1 mg/dl. Compared to the alarm in Figure 1, the CUSUM method behaves more conservatively before raising an alarm (time to detection is reduced to 10 minutes).
Figure 2.

(A) Alarm triggered with method B (CUSUM). Time to detection is 10 minutes. (B) CUSUM control chart used for alarm decision. An alarm is issued when the Ck− exceeds the limit H.
Figure 3 shows the EWMA control chart and the alarm issued by this method (triggered by values below LCL). Tuning parameters μ0 and σ were assigned the same values as in the CUSUM method (μ0 = 65 mg/dl and σ = 1 mg/dl). The constant λ in Equation (7) is set to 0.8 after searching for its optimal value, and the width of control limits L is 5. Figure 3A shows that the alarm is issued 15 minutes (time to detection) before the hypoglycemic event.
Figure 3.
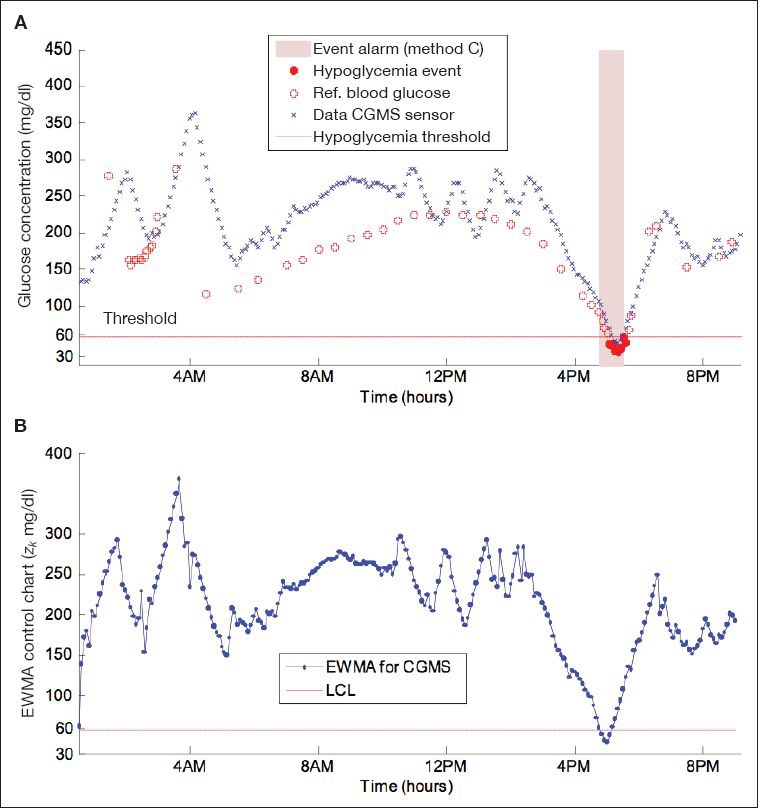
(A) Alarm triggered with method C (EWMA). Time to detection is 15 minutes. (B) EWMA control chart used for alarm decision. An alarm is issued when the zk crosses the LCL.
For the entire patient population, the performance of each method proposed is summarized in Table 1. For the 54 subjects (83 CGMS) studied, a hypoglycemic event was achieved by 37 (65%) subjects wearing a total of 56 CGMS sensors. A true positive alarm occurred for 50 of the 56 CGMS (89% sensitivity) with method A, 49 (87.5% sensitivity) with method B, and 50 (89% sensitivity) with method C. The mean time to detection was 30 ± 5.51 minutes for alarms issued by method A, and this value reduced to 25.8 ± 6.46 and 27.7 ± 5.32 minutes for methods B and C.
Table 1.
Performance Results with Methods A, B, and C
| Method A (absolute value) | Method B (CUSUM) | Method C (EWMA) | |
|---|---|---|---|
| True positive | 50 | 49 | 50 |
| False positive | 9 | 7 | 6 |
| False negative | 6 | 7 | 6 |
| True negative | 18 | 20 | 21 |
| Sensitivity (%) | 89 | 87.5 | 89 |
| Specificity (%) | 67 | 74 | 78 |
| False alarm rate 1a (%) | 33 | 26 | 22 |
| False alarm rate 2b (%) | 15 | 12.5 | 11 |
| Time to detectionc (min) | 30 (5.51) | 25.8 (6.46) | 27.7 (5.32) |
Percentage of incorrectly alarmed nonhypoglycemic events. False alarm rate 1 = false positive/(false positive + true negative).
Percentage of incorrect alarms among all alarms issued. False alarm rate 2 = false positive/(false positive + true positive).
Reported are mean values for time to detection with standard deviation given in parentheses.
The 17 subjects who did not experience a hypoglycemic event wore a total of 27 CGMS sensors. With method A, 9 of the 27 CGMS raised a false positive alarm, and an absence of hypoglycemia was identified correctly in 67% (specificity) of the cases. The number of false positive alarms was reduced to 7 and 6 with methods B and C, respectively. Specificity increased to 74 and 78% with methods B and C.
Discussion
This work evaluated the use of our recursive glucose prediction algorithm for early hypoglycemic alarms. Three different methods were proposed and compared for hypoglycemia prediction. Sensitivity to predict hypoglycemia correctly was not significantly different among the three methods. However, results showed that both CUSUM and EWMA control chart-based methods increase the specificity compared to the absolute value method by reducing the number of false alarms. This can be explained with the more conservative behavior of CUSUM and EWMA methods before raising an alarm (reduced time to detection). Mean time to detection was 25 minutes or above with any of the methods proposed, which provide enough time for the patient to prevent the anticipated hypoglycemia (e.g., food intake or insulin adjustment).
Both CUSUM- and EWMA-based methods contain a few parameters that require some tuning. The absolute predicted value method does not include any tuning and therefore its implementation is more straightforward.
Prediction performance is also highly dependent on sensor accuracy, as the predicted glucose concentrations are based on sensor data. For many of the currently available CGM devices, accuracy, especially during hypoglycemia, is reported as significantly poor.14 More accurate glucose readings will definitely improve the performance of the early alarms proposed.
Other parameters that affect alarm performance are the prediction horizon and the threshold for hypoglycemia. Small prediction horizons will increase the sensitivity of early alarms. However, the prediction horizon should also be kept long enough to ensure time for the necessary intervention (e.g., food ingestion) to avoid hypoglycemia. This work investigated a relatively large prediction horizon (30 minutes). The prediction algorithm provides 30-minute-ahead predicted glucose values that closely follow sensor data (Figure 1), which improves the alarm performance (sensitivity). Increasing the threshold also improves the sensitivity to predict hypoglycemia. However, it results in increased false alarms, which might frustrate patients and lead them to ignore the alarms. Also, the hypoglycemic threshold should only be increased to a certain extent because an alarm with a threshold of 70 mg/dl or above may not be regarded as important by many patients.
Abbreviations
- ARMA
autoregressive moving-average model
- CG-EGA
continuous glucose-error grid analysis
- CGM
continuous glucose monitoring
- CGMS
Continuous Glucose Monitoring System
- CUSUM
cumulative-sum control chart
- DirecNet
Diabetes Research in Children Network
- EWMA
exponentially weighted moving-average control chart
- LCL
lower control limit
- WRLS
weighted recursive least squares
References
- 1.The Diabetes Control and Complications Trial Research Group. The effect of intensive treatment of diabetes on the development and progression of long-term complications in insulin-dependent diabetes mellitus. N Engl J Med. 1993;329(14):977–986. doi: 10.1056/NEJM199309303291401. [DOI] [PubMed] [Google Scholar]
- 2.UK Prospective Diabetes Study (UKPDS) Group. Intensive blood-glucose control with sulphonylureas or insulin compared with conventional treatment and risk of complications in patients with type 2 diabetes (UKPDS 33) Lancet. 1998;352(9131):837–853. [PubMed] [Google Scholar]
- 3.Eren-Oruklu M, Cinar A, Quinn L, Smith D. Estimation of future glucose concentrations with subject-specific recursive linear models. Diabetes Technol Ther. 2009;11(4):243–253. doi: 10.1089/dia.2008.0065. [DOI] [PMC free article] [PubMed] [Google Scholar]
- 4.Eren-Oruklu M, Cinar A, Quinn L, Smith D. Adaptive control strategy for regulation of blood glucose levels in patients with type 1 diabetes. J Process Control. 2009;19(8):1333–1346. [Google Scholar]
- 5.Bequette BW. Optimal estimation applications to continuous glucose monitoring. Proceedings 2004 American Control Conference; 2004. pp. 958–962. [Google Scholar]
- 6.Palerm CC, Bequette BW. Hypoglycemia detection and prediction using continuous glucose monitoring—-a study on hypoglycemic clamp data. J Diabetes Sci Technol. 2007;1(5):624–629. doi: 10.1177/193229680700100505. [DOI] [PMC free article] [PubMed] [Google Scholar]
- 7.Knobbe EJ, Buckingham B. The extended Kalman filter for continuous glucose monitoring. Diabetes Technol Ther. 2005;7(1):15–27. doi: 10.1089/dia.2005.7.15. [DOI] [PubMed] [Google Scholar]
- 8.Rollins DK, Bhandari N, Kotz KR. Critical modeling issues for successful feedforward control of blood glucose in insulin dependent diabetics. Proceedings of the 2008 American Control Conference; 2008. pp. 832–837. [Google Scholar]
- 9.Finan DA, Zisser H, Jovanovic L, Bevier WC, Seborg DE. Identification of linear dynamic models for type 1 diabetes: a simulation study. Proceedings of the 2006 International Symposium on Advanced Control of Chemical Processes; 2006. pp. 503–508. [Google Scholar]
- 10.Sparacino G, Zanderigo F, Corazza S, Maran A, Facchinetti A, Cobelli C. Glucose concentration can be predicted ahead in time from continuous glucose monitoring sensor time-series. IEEE Trans Biomed Eng. 2007;54(5):931–937. doi: 10.1109/TBME.2006.889774. [DOI] [PubMed] [Google Scholar]
- 11.The Diabetes Research in Children Network (DirecNet) Study Group (protocol A)[cited 2009 Aug 11] Available from: http://public.direc.net/general/datasetDownload.php?Study=DirecNet.
- 12.The Diabetes Research in Children Network (DirecNet) Study Group. Accuracy of GlucoWatch G2 Biographer and the continuous glucose monitoring system during hypoglycemia: experience of the Diabetes Research in Children Network (DirecNet) Diabetes Care. 2004;27(3):722–726. doi: 10.2337/diacare.27.3.722. [DOI] [PMC free article] [PubMed] [Google Scholar]
- 13.Tsalikian E, Kollman C, Mauras N, Weinzimer S, Buckingham B, Xing D, Beck R, Ruedy K, Tamborlane W, Fiallo-Scharer R Diabetes Research in Children Network (DirecNet) Study Group. GlucoWatch G2 Biographer (GW2B) alarm reliability during hypoglycemia in children. Diabetes Technol Ther. 2004;6(5):559–566. doi: 10.1089/dia.2004.6.559. [DOI] [PMC free article] [PubMed] [Google Scholar]
- 14.Klonoff DC. The need for separate performance goals for glucose sensors in the hypoglycemic, normoglycemic, and hyperglycemic ranges. Diabetes Care. 2004;27(3):834–836. doi: 10.2337/diacare.27.3.834. [DOI] [PubMed] [Google Scholar]
- 15.Weinstein RL, Schwartz SL, Brazg RL, Bugler JR, Peyser TA, McGarraugh GV. Accuracy of the 5-day FreeStyle Navigator Continuous Glucose Monitoring System: comparison with frequent laboratory reference measurements. Diabetes Care. 2007;30(5):1125–1130. doi: 10.2337/dc06-1602. [DOI] [PubMed] [Google Scholar]
- 16.Bode B, Gross K, Rikalo N, Schwartz S, Wahl T, Page C, Gross T, Mastrototaro J. Alarms based on real-time sensor glucose values alert patients to hypo- and hyperglycemia: the guardian continuous monitoring system. Diabetes Technol Ther. 2004;6(2):105–113. doi: 10.1089/152091504773731285. [DOI] [PubMed] [Google Scholar]
- 17.Garg S, Zisser H, Schwartz S, Bailey T, Kaplan R, Ellis S, Jovanovic L. Improvement in glycemic excursions with a transcutaneous, real-time continuous glucose sensor: a randomized controlled trial. Diabetes Care. 2006;29(1):44–50. doi: 10.2337/diacare.29.01.06.dc05-1686. [DOI] [PubMed] [Google Scholar]
- 18.Yamaguchi M, Kaseda C, Yamazaki K. Prediction of blood glucose level of type 1 diabetics using response surface methodology and data mining. Med Biol Eng Comput. 2006;44(6):451–457. doi: 10.1007/s11517-006-0049-x. [DOI] [PubMed] [Google Scholar]
- 19.Iokibe T, Yoneda M, Kakita K. Chaos based blood glucose prediction and insulin adjustment for diabetes mellitus. Proceedings of the IEEE-EMBS Asian-Pacific Conference; 2003. pp. 86–87. [Google Scholar]
- 20.Katayama T, Sato T, Minato K. A blood glucose prediction system by chaos approach. Proceedings of the IEE-EMBS Annual International Conference; 2004. pp. 750–753. [DOI] [PubMed] [Google Scholar]
- 21.Bellazzi R, Magni P, De Nicolao G. Bayesian analysis of blood glucose time series from diabetes home monitoring. IEEE Trans Biomed Eng. 2000;47(7):971–975. doi: 10.1109/10.846693. [DOI] [PubMed] [Google Scholar]
- 22.Bellazzi R, Larizza C, Magni P, Montani S, Stefanelli M. Intelligent analysis of clinical time series: an application in the diabetes mellitus domain. Artif Intell Med. 2000;20(1):37–57. doi: 10.1016/s0933-3657(00)00052-x. [DOI] [PubMed] [Google Scholar]
- 23.Van Herpe T, Espinoza M, Pluymers P, Wouters P, De Smet F, Van Den Berghe G, De Moor B. Development of a critically ill patient input-output model. Proceedings of the 14th IFAC Symposium System Identification; Newcastle, Australia: 2006. [Google Scholar]