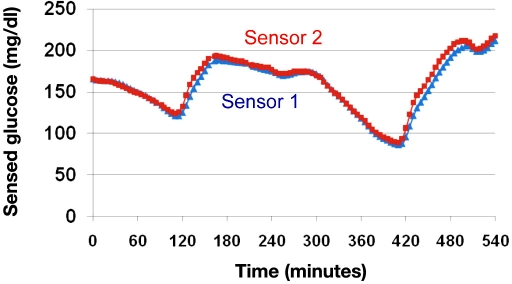
Figure 1.
Two subcutaneous sensors in a person with type 1 diabetes undergoing closed-loop control. Blue symbols indicate data from sensor 1, and red symbols indicate data from sensor 2. Note that the two sensors track each other very well; the tracings are nearly superimposable. Sensors were calibrated once at the onset of the study.

