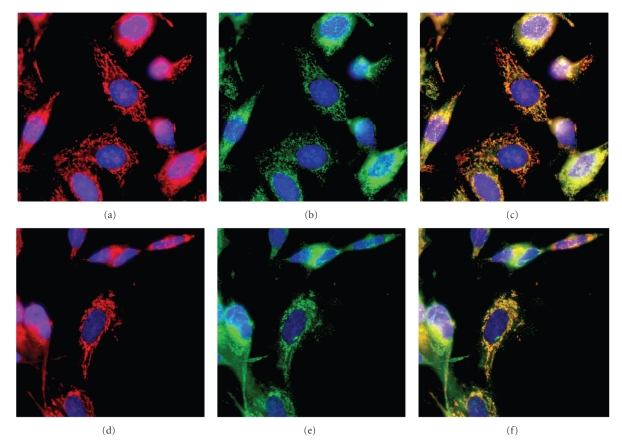
Figure 5.
Cellular expression of TOM1L colocalize with the mitochondria. Confocal imaging of SK-N-SH neuroblastoma cells ((a)–(c)) or HeLa cells ((d)–(f)) stained with MitoTracker Red and antibodies against TOM1L. Individual images were separated digitally: ((a) and (d)) MitoTracker Red (red), ((b) and (e)) anti-TOM1L (green), and merged images ((c) and (f)). Cells were stained with DAPI (blue) to visualize the localization of the nucleus.

