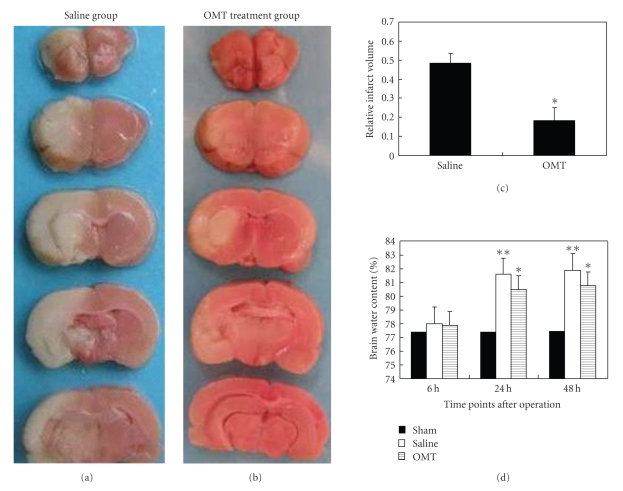
Figure 2.
Relative infarct volume and water content in the brain. (a) and (b) TTC stain: comparison of infarct size between the saline group and OMT treatment group at 24 hours. The white region was the infarction and the red region was normal brain tissue. (c) Relative infarct volume: calculating and comparing the percentage of infarct region occupying the whole brain tissue area in one section revealed that it decreased by 32% in the OMT treatment group compared with the saline group at 24 hours. *P < .05 compared with saline group. (d) Water content of cerebral tissue: there was no difference at 6 hours among the test groups. It increased at 24 hours in the saline group and lasted up to 48 hours in the saline group at identical time points. Water content in the OMT treatment group decreased at 24 hours and 48 hours after the operation compared with that in the saline group at the same time points. Results are means ± SD of each group. **P < .01 and *P < .05 compared with Sham.

