Figure 6.
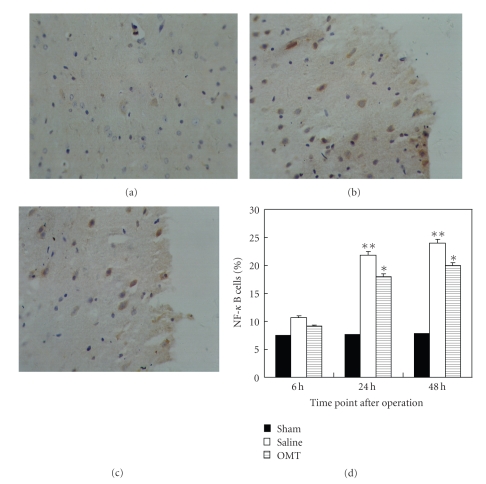
NF-κB expression detected by immunohistochemistry. (a) NF-κB expression in the sham group: NF-κB expression could be observed periodically in the sham group at 24 hours. (b) NF-κB expression in the saline group: NF-κB expression evidently increased in the saline group at 24 hours. Positive cells were defined as haning buffy grains in the cellular nucleus and cytoplasm. (c) NF-κB expression in the OMT treatment group: NF-κB expression decreased relatively in the OMT treatment group at 24 hours. (d) NF-κB expression in each group at all time points: there was no difference among all test groups at 6 hours. It was evidently higher in the saline group at 24 hours and lasted up to 48 hours. Compared with the saline group at identical time points, NF-κB expression was lower in the OMT treatment group, and the difference was significant **P < .01 and *P < .05 compared with Sham.

