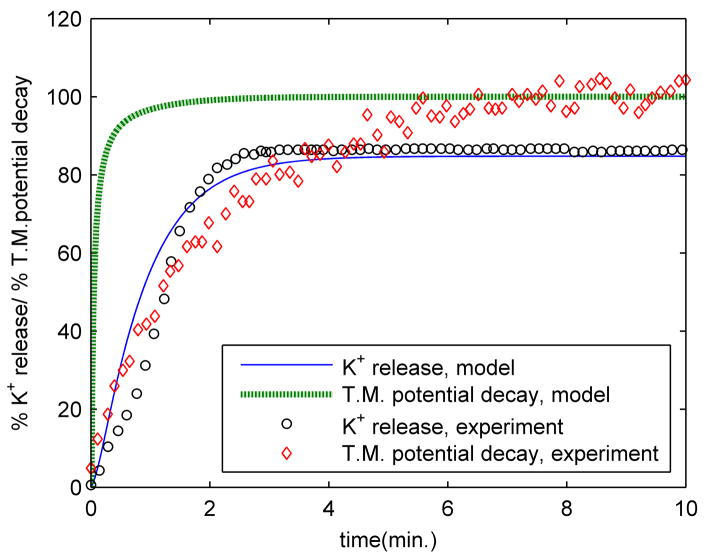
Figure 4.
Comparison of potassium release and transmembrane potential decay between model and experiment. Experimental measurements were carried out on exponential phase E. coli. The experimental transmembrane potential decay data corresponds to the relative fluorescence of diSC3-5 observed. The model data corresponds to setting the number of pores to 43 in order to match the K+ release data for this particular experiment.

