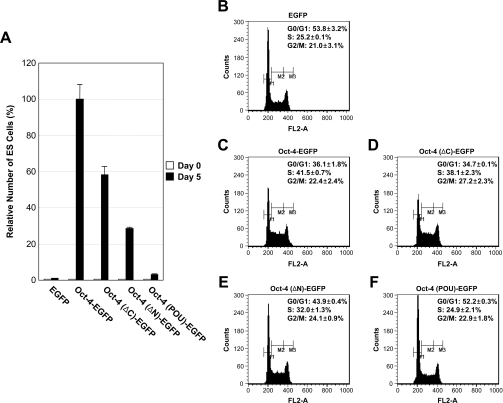
Figure 3. Functional regions of Oct-4 required for stimulation of S-phase entry of ES cells.
(A) Relative growth rate of ZHBTc4 ES cells expressing Oct-4 deletion mutants. Cells (3×10³) were plated on to 0.2% gelatin-coated 35-mm dishes and counted at 5 days with a haemocytometer. Relative self-renewal ability values are shown to the right, with the value obtained by Oct-4 taken as 100%. Each bar represents the average values of two experiments. Three independent experiments gave similar results. (B–F) Effects of Oct-4 deletion mutants on ES cell-cycle progression. DNA contents of ZHBTc4 ES cells expressing EGFP (B), Oct-4–EGFP (C), Oct-4(ΔC)–EGFP (D), Oct-4(ΔN)–EGFP (E) or Oct-4(POU)–EGFP (F) were measured by fluorescence with PI staining. M1, M2 and M3 represent gating for G0/G1, S and G2/M populations respectively. Values shown are means±S.D. Three independent experiments gave similar results.

