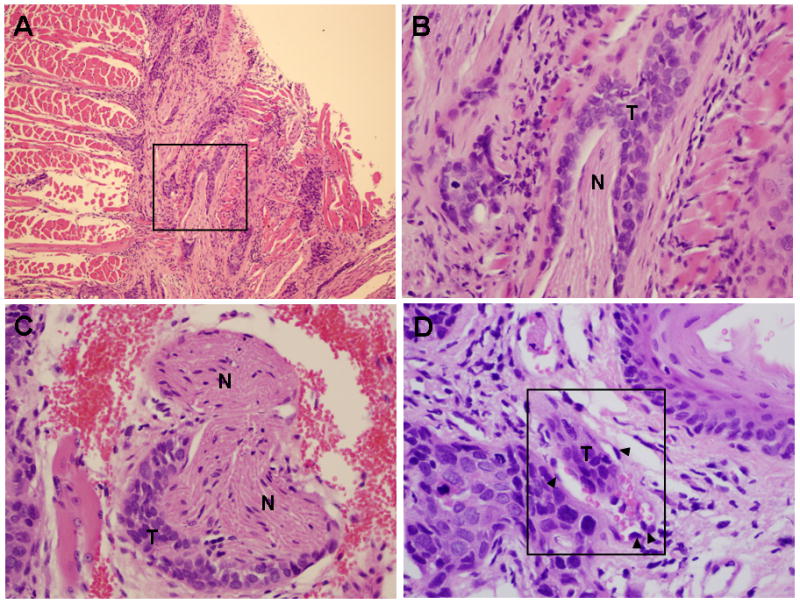
Figure 2. Perineural and vascular invasion in SCC-25-uPAR+ tumors.

(A–C) Representative H&E sections showing tumor cords surrounding nerve bundle. (T) – tumor, (N) – nerve. Panel A – 100X magnification, panels B,C – 400X magnification. (D) Representative H&E section showing tumor localization within a small vessel (boxed area). Magnification 600X. (T) – tumor tissue; (arrowheads) – vascular endothelial cells. Note red blood cells also present in the vessel.
