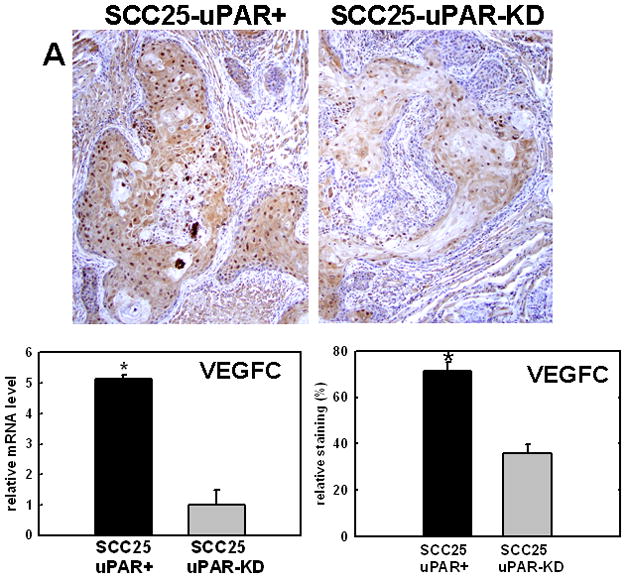
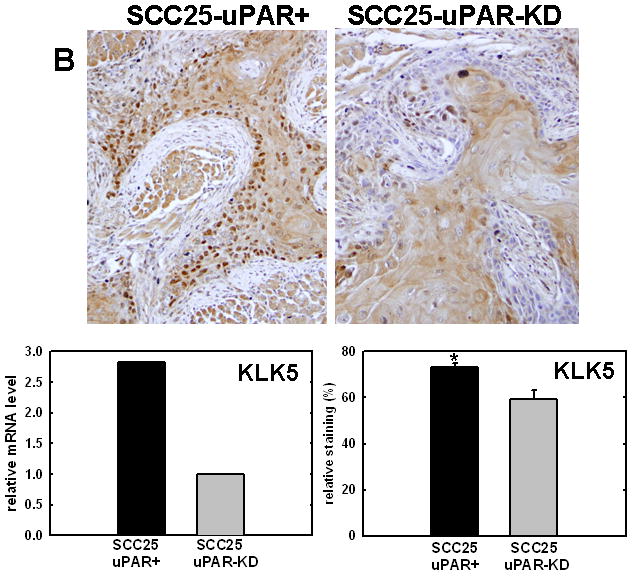
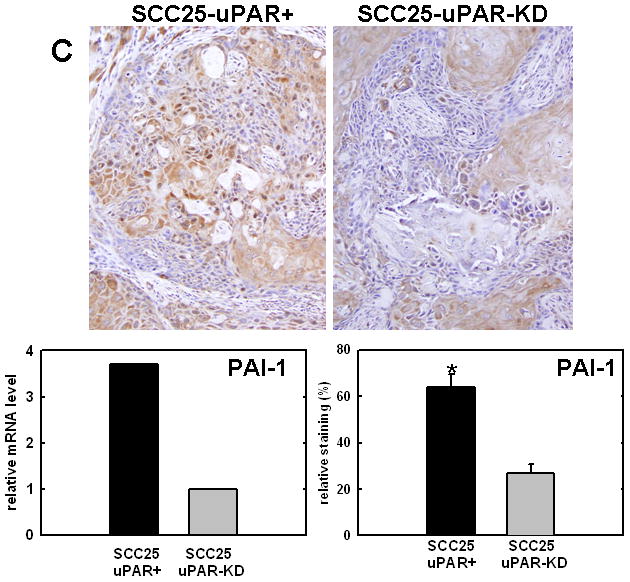
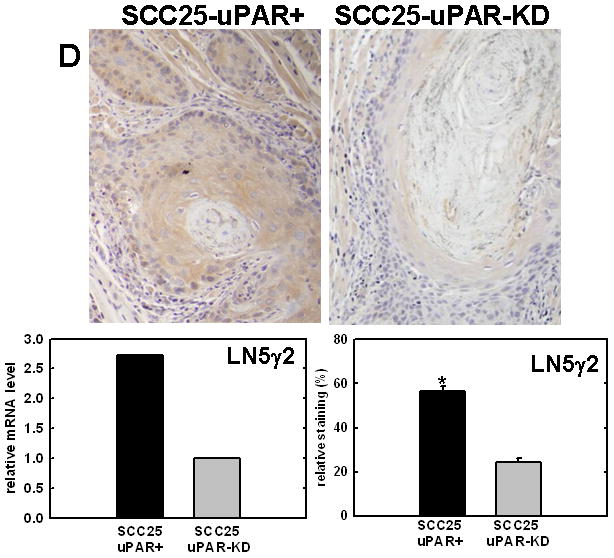
Figure 4. Validation of cDNA microarray results using immunohistochemical analysis of murine tongue tumors and qPCR.


Representative sections from SCC25-uPAR+ or SCC25-uPAR-KD tumors were immunostained with (A) anti-VEGF-C (1:20 dilution), (B) anti-kallikrein-5 (1:25 dilution), (C) anti-PAI-1 (1:20 dilution) or (D) anti-laminin-γ2 chain (1:20 dilution) followed by biotinylated secondary antibody as in Experimental Procedures. 100X magnification. Corresponding qPCR analyses of gene expression in SCC25-uPAR+ and SCC25-uPAR-KD cell lines (left) and quantitation of immunohistochemical staining in murine tumors (right) are shown in the bar graphs. For qPCR, relative expression levels were normalized to housekeeping gene PGK. Each bar depicts the mean of replicate values expressed as fold-difference in mRNA level relative to SCC25-uPAR-KD cells (designated as 1, grey bars). (black bar) - SCC25-uPAR+, (grey bar) – SCC25-uPAR-KD. For quantitation of tumor staining, 2500–6000 cells from 10 tumor sections were scored and results are presented as relative staining (% of total cell number scored).
