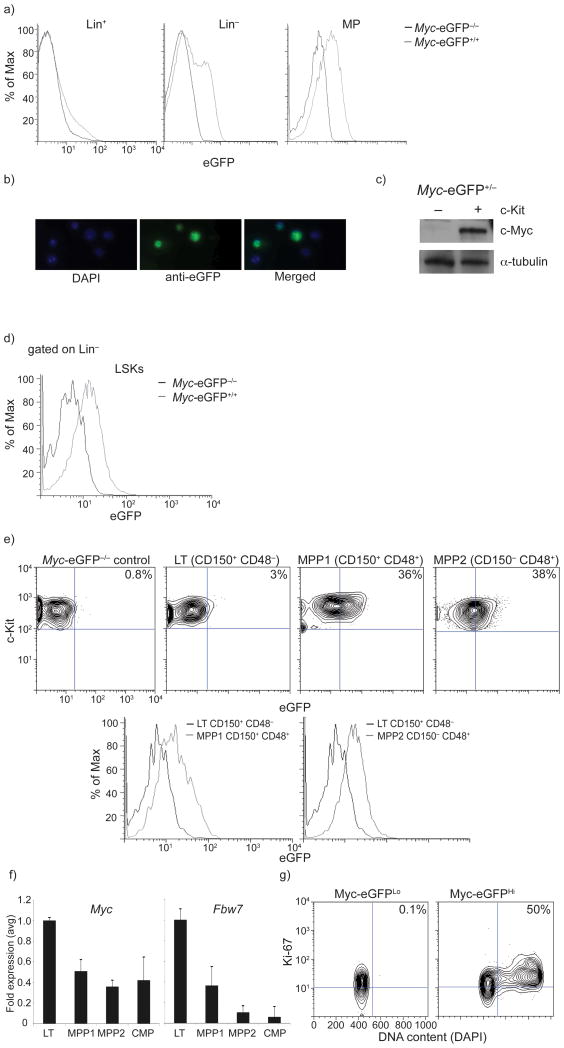
Figure 1. Visualization of c-Myc protein abundance in early hematopoiesis.
a) Levels of c-Myc-eGFP expression during early hematopoiesis in Lineage+, Lineage−, LSK (Lineage−, c-Kit+, Sca1+) and MP (lineage−, c-Kit+, Sca1) BM subsets. n=6 mice b) Immuno-fluorescence tracing of nuclear c-Myc-eGFP expression in Lineage− bone marrow progenitors. c) Western blot demonstrating presence of c-Myc protein in c-Kit+ and absence in c-Kit− subset of adult bone marrow. d) Overlay histogram depicting c-Myc-eGFP protein expression within LSK cells. e) c-Myc-eGFP expression in eGFP−/−control, LT-HSC and MPP (1, 2) populations. f) qRT-PCR quantification of Myc and Fbw7 mRNA expression during HSC differentiation. g) Levels of c-Myc-eGFP protein correlate with the cell cycle status of LSK cells. Sorted c-Myc-eGFPHi or c-Myc-eGFPLo LSK cells were analyzed using Ki-67 and DAPI staining. Plots are a representation of at least 3 independent experiments.

