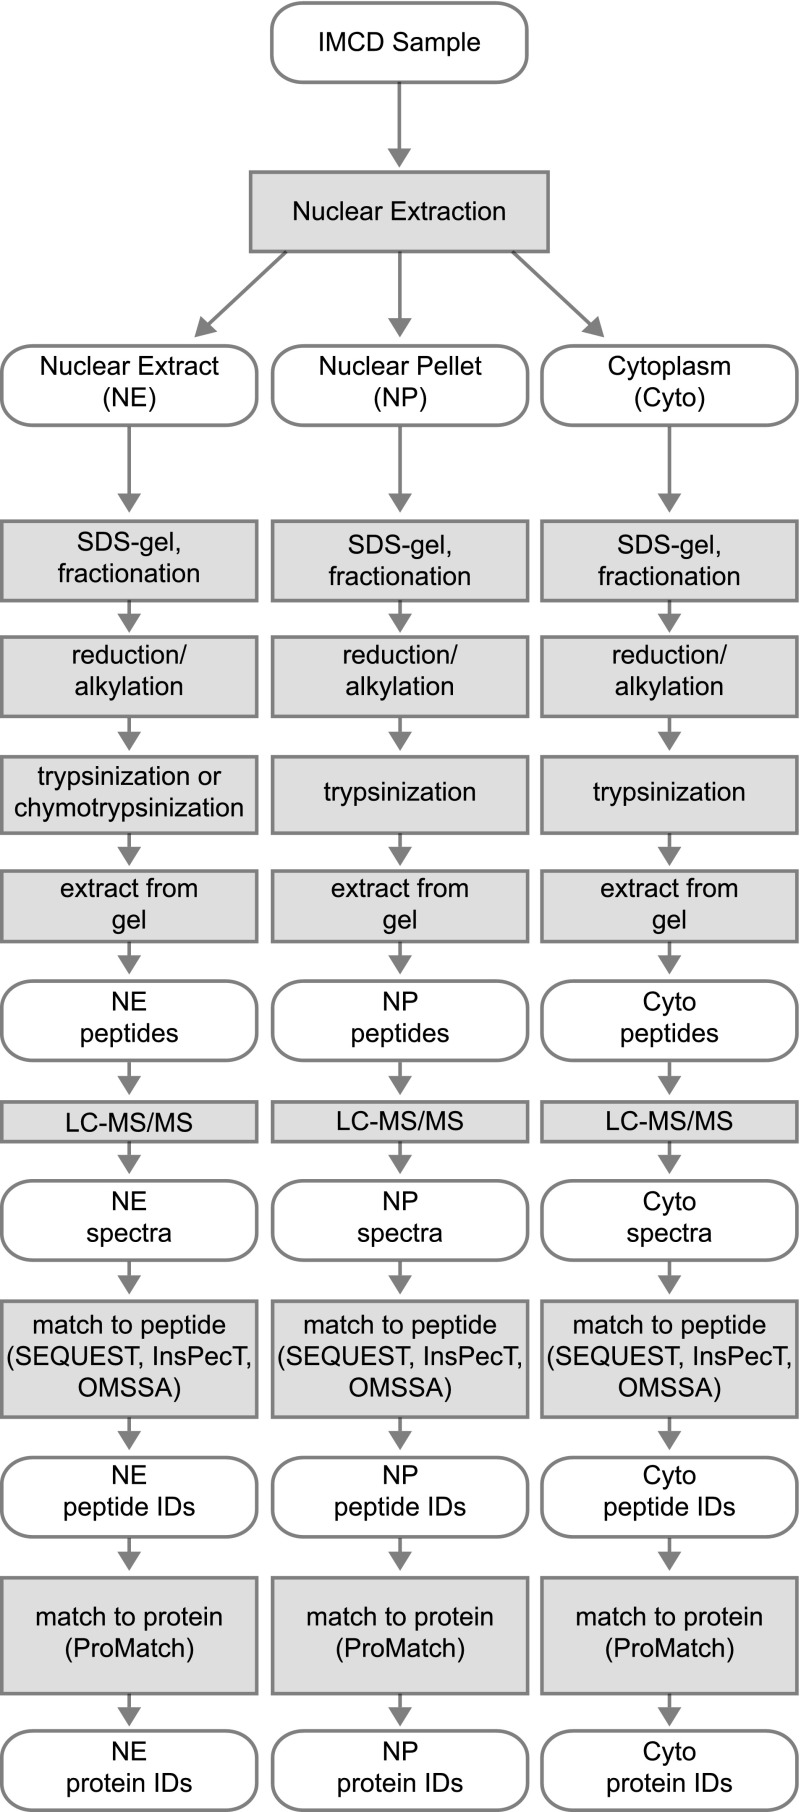
Fig. 2.
Proteomic work flow. Graphical representation of the complete workflow used for this proteomic study. The ovals represent the experimental samples, spectra, or proteomic data. Shaded boxes represent the biochemical and computational methods that were applied to the biological samples and data.

