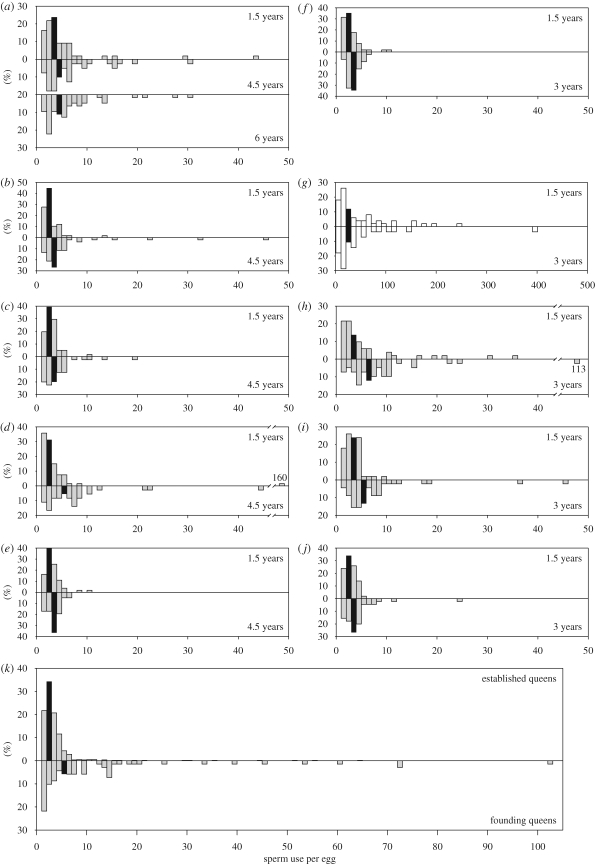
Figure 2.
(a–j) Histograms showing the frequency distributions of the number of sperm per egg in 10 queens for which multiple samples could be obtained, with earlier samples presented above samples taken at later age ((a) queen A, (b) queen B, (c) queen C, (d) queen D, (e) queen E, (f) queen F, (g) queen G, (h) queen H, (i) queen I, and (j) queen J). Note that queen A was sampled three times and that the x-axis for queen G is an order of magnitude greater than for the other queens. (k) Histograms showing the frequency distribution of the number of sperm per egg combined for 15 queens with established colonies (upper graph), based on the first sample for each queen, and for 10 founding queens collected directly after their mating flight (lower graph). The black bar in each histogram contains the median number of sperm per egg.

