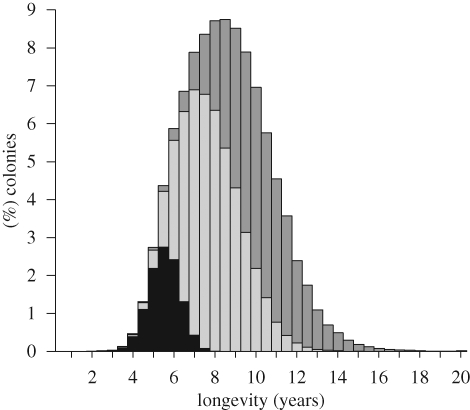
Figure 4.
Histogram of colony longevity, based purely on sperm limitation, as predicted by the heuristic model. Each bar is shaded according to the contribution of model colonies with low (dark grey) (less than two), medium (light grey) (2–10) and high (black) (more than 10) values of initial sperm use per egg.

