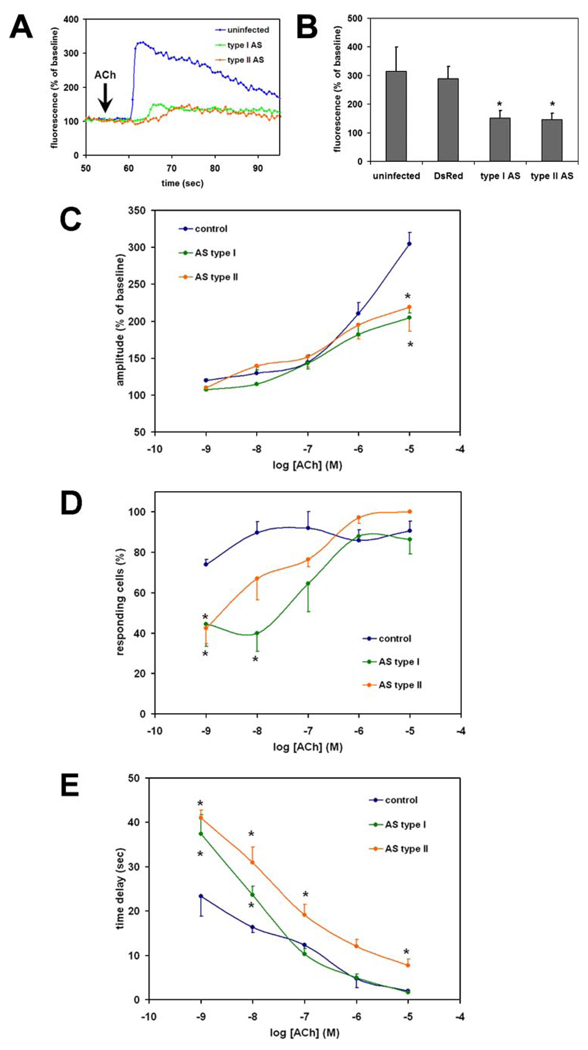
FIGURE 4. Type I and II InsP3R contribute similarly to Ca2+ signaling in AR4-2J cells.
Cells were loaded with Fluo-4 and stimulated with ACh (10 µm), and the resulting cytosolic Ca2+ signal was monitored by confocal microscopy. A, tracings from representative single cells that were not transfected (blue) or transfected with antisense for the type I (red) or type II (green) InsP3R. B, summary of results. The amplitude of the ACh-induced Ca2+ signal was not decreased relative to uninfected controls in cells infected with adenoviral DsRed, but it was decreased significantly and to a similar extent in cells infected with either adenoviral antisense (*, p < 10−10 for both antisense groups; n = 20–22 cells for each of the four groups). Values shown are mean ± S.D. C, amplitude of the ACh-induced Ca2+ signal for a range of ACh concentrations. Cells lacking either the type I or type II InsP3R have a decreased response to ACh relative to nontransfected controls, but only for high ACh concentrations (*, p < 0.05). D, percentage of cells in which ACh increases cytosolic Ca2+ in AR4-2J cells. Cells lacking either the type I or type II InsP3R have decreased sensitivity to low concentrations of ACh relative to nontransfected controls (*, p < 0.05). E, time lag between exposure to ACh and onset of Ca2+ signal (measured only in those cells in which a Ca2+ increase occurs). A significant delay is detected upon stimulation with a range of concentrations of ACh in AR4-2J cells lacking either type I or type II InsP3Rs (*, p < 0.05). C–E, an average of 130 cells was examined in each experimental group at each concentration of ACh. Values are mean ± S.E.

