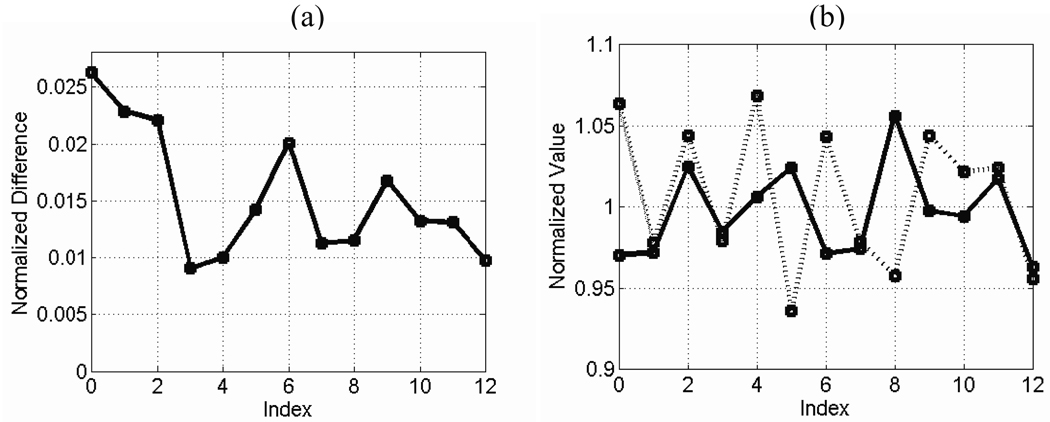
Figure 3.
Baseline error measurement: repeated images were taken of a non-uniform water phantom (reshimming each time) without any shield or tubes present and were analyzed for baseline variation. Plots are shown of (a) NMRSE, (b) normalized SNR (solid line), and normalized linewidth (dashed line) versus repetition index.

