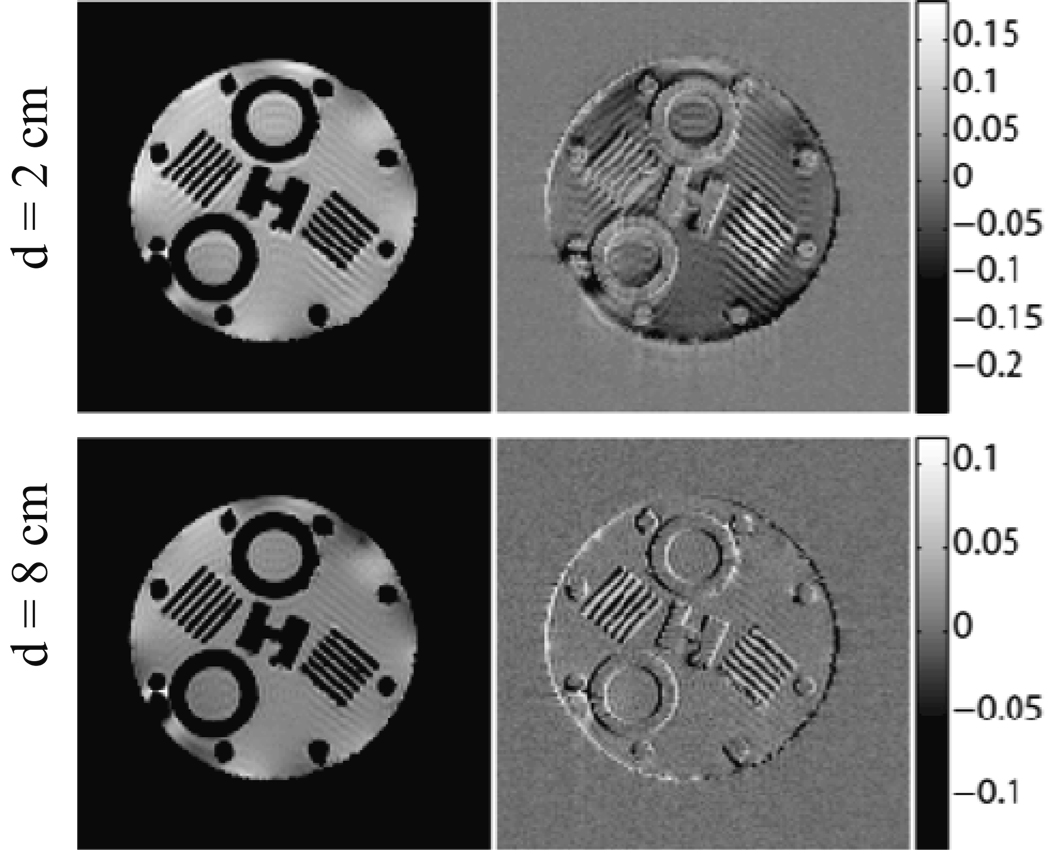
Figure 5.
GE images are displayed for shielding locations d = 2 cm (top) and d = 8 cm (bottom) using the shielding model. Normalized error (or difference) images with respect to the reference images are shown to the right of each GE image with color bars of error values normalized to reference image maxima.

