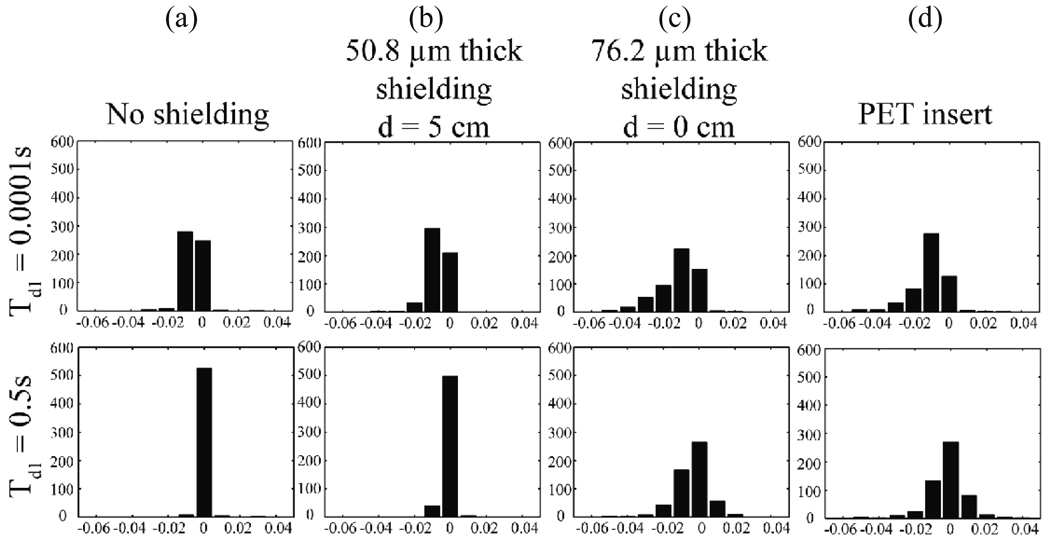
Figure 7.
Histograms are plotted of the frequency shifts shown in Fig. 6. Results are shown for (a) no shielding, (b) 50.8 µm (0.002”) shielding model at d = 5 cm, (c) 76.2 µm (0.003”) shielding model at d = 0 cm, and (d) the full PET insert. Top (bottom) row corresponds to Td = 0.0001 s (0.5 s).

