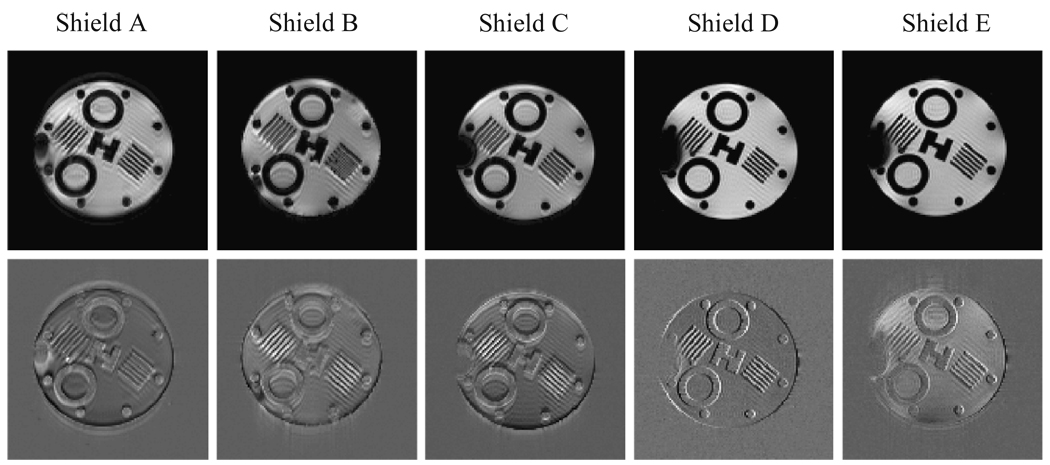
Figure 9.
GE images (top row) are shown for five different shielding models. All images were acquired with d = 0 cm. Corresponding normalized error (difference) images, with respect to reference images, are shown in the bottom row. Shields A, B, and C are continuous copper cylinders of a single layer with thickness of 76.2 µm, 50.8 µm, and 25.4 µm (0.003”, 0.002”, and 0.001”) respectively. Shield D is 50.8 µm (0.002”) thick with axial gaps. Shield E has two 25.4 µm (0.001”) thick layers—the outer one with axial gaps.

