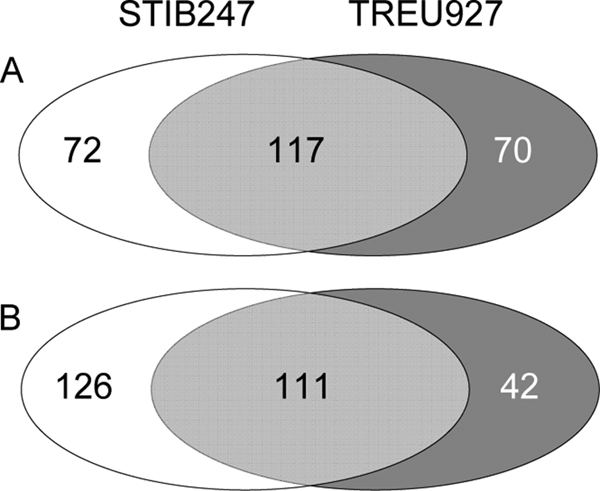
FIG. 3.

The number of genes significantly differentially expressed (FDR of <1) between trypanosome-infected and uninfected mouse spleens. The overlap represents commonality in strain 247- and 927-induced changes relative to uninfected controls, and numbers to the left and right are the strain-specifically regulated genes at this FDR level. Panel A represents genes upregulated in strain 927- or 247-infected mice relative to control mice, and panel B represents genes downregulated in strain 927- or 247-infected mice relative to control mice.
