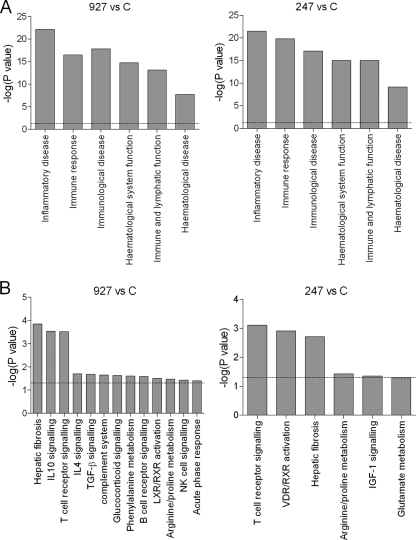
FIG. 4.
Significantly differentially regulated biological functions (A) and canonical pathways (B) between strain 247-infected and uninfected mice (247 versus C) and between strain 927-infected and uninfected mice (927 versus C), as identified by IPA. The y axis is the negative log of the Fischer exact test P value for the genes identified with the respective biofunction or canonical pathway. The dashed line indicates the threshold of significance (P < 0.05).

