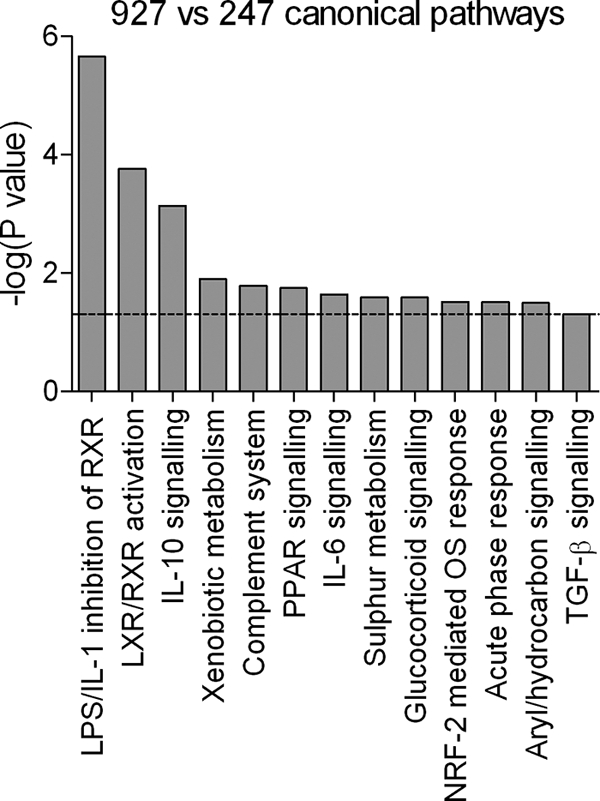
FIG. 5.

Canonical pathways significantly differentially regulated in strain 247- and strain 927-infected mice. The bar chart shows the Fischer exact test P values determining the probability that the association between the genes in the data set and the canonical pathway is explained by chance alone (the significance threshold of P < 0.05 is indicated by the dashed line).
