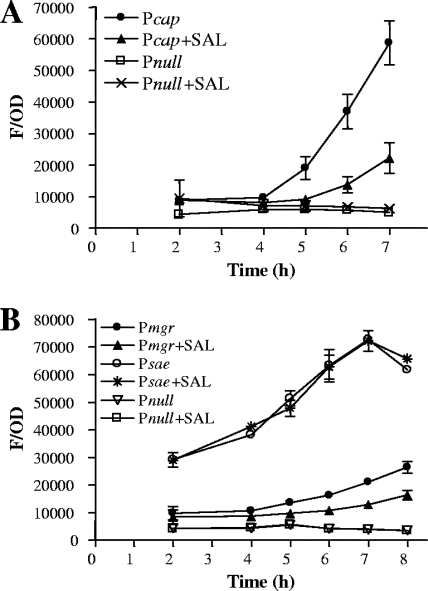
FIG. 2.
Effect of SAL on cap5 (A), mgrA (B), and sae P3 (B) promoter activities. Expression of gfp driven by the target promoters was measured during the growth cycle, and fluorescence values were expressed as green fluorescent protein fluorescence related to the OD650 (F/OD) in order to minimize variations in fluorescence due to varying cell density. The data represent the arithmetic means ± standard deviations for triplicate measurements from three or four independent experiments.

