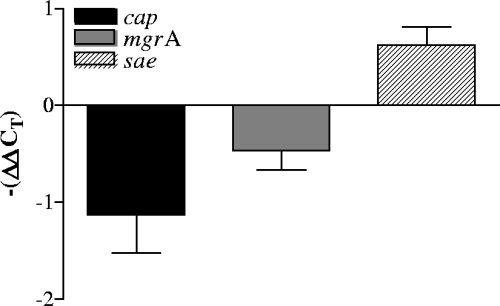
FIG. 3.
Real-time PCR analysis of cap, mgrA, and sae transcription. Changes in gene expression are shown as fold changes [−(ΔΔCT)] following growth with 50 μg/ml of SAL to an OD650 of 1.4. The data represent the means ± standard deviations for duplicate measurements from three independent experiments.

