
FIG. 1.
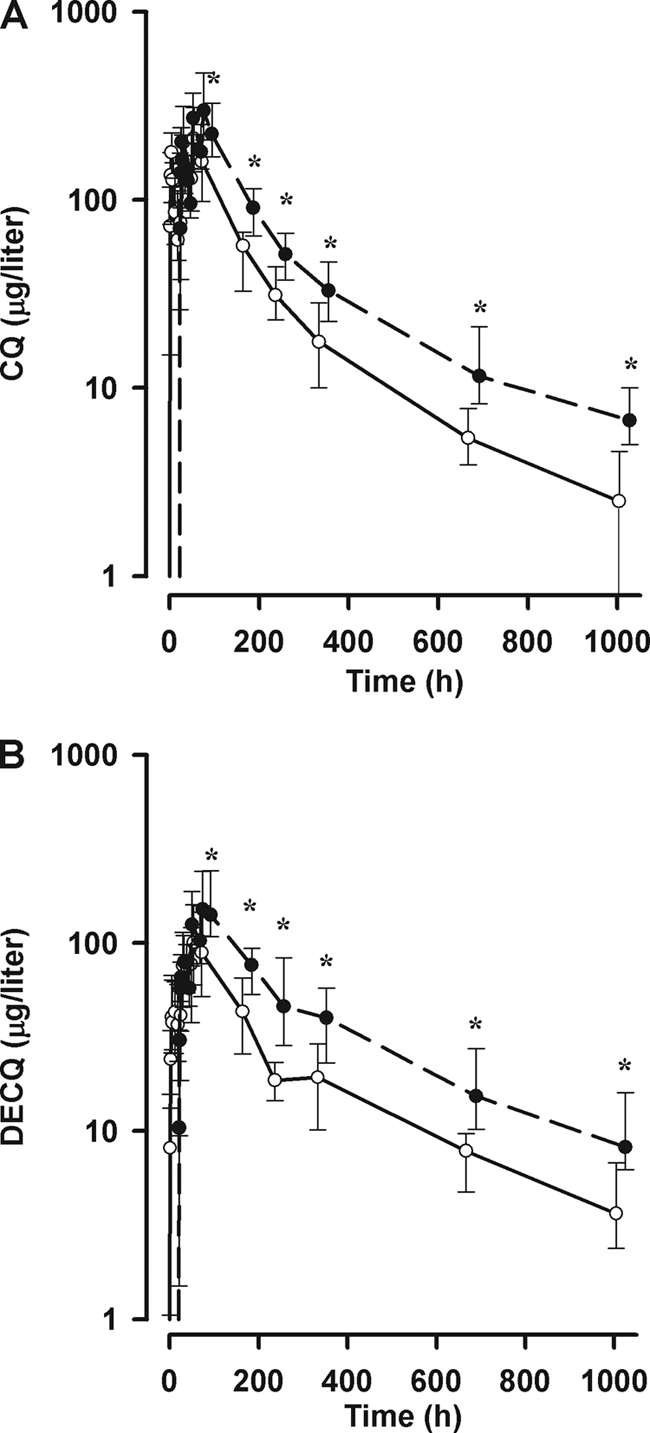
CQ (A) and DECQ (B) concentrations in pregnant (solid line) and nonpregnant (dashed line) groups. Data are medians and interquartile ranges. Significant differences (P < 0.001) between pregnant and nonpregnant subjects at individual time points are indicated by asterisks.