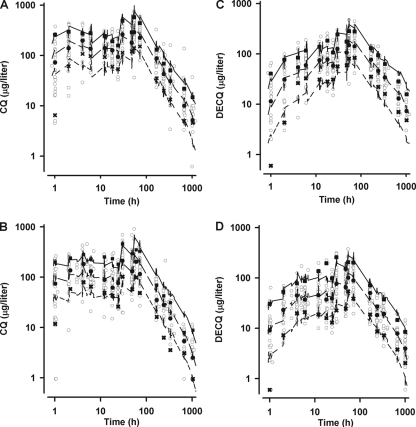
FIG. 3.
Visual predicted check plots showing simulated 10th (short dashed line), 50th (long dashed line), and 90th (solid line) percentile concentrations and observed concentration (log scale) data (○) versus time (log scale) for CQ (panel A, nonpregnant; panel B, pregnant) and DECQ (panel C, nonpregnant; panel D, pregnant). The 10th (×), 50th (•), and 90th (▪) percentiles for the observed data are also shown.

