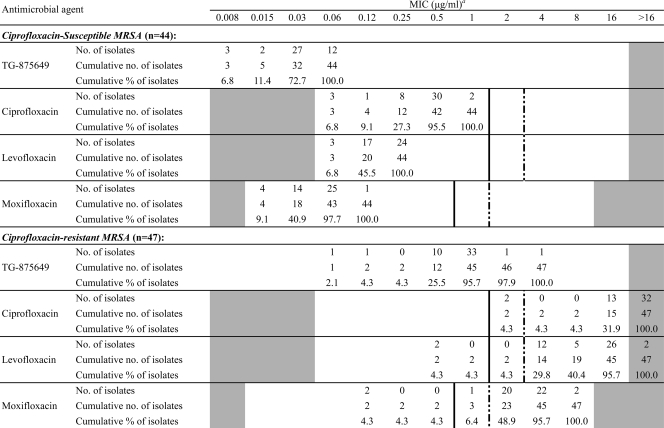
TABLE 2.
MIC distribution of TG-875649 and comparator fluoroquinolone agents against ciprofloxacin-susceptible and -resistant, methicillin-resistant S. aureus (MRSA)
MICs before vertical solid lines, between solid and dotted lines, and after dotted lines indicate susceptible, intermediate, and resistant breakpoints, respectively, based on CLSI interpretive criteria (2). The white fields denote range of dilutions tested for each agent. Values above the range denote MICs greater than the highest concentration tested. MICs equal to or lower than the lowest concentration tested are given as the lowest concentration.

