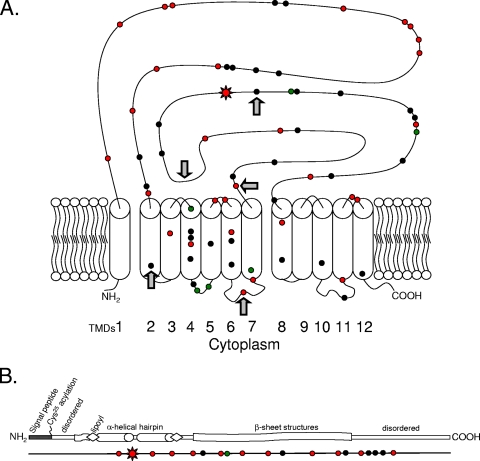
FIG. 1.
SNP locations relative to the primary protein sequence and secondary structures using E. coli K-12 as a reference. Symbols: black circles, SNP observed in more than one strain pool; red or green circles, SNP observed in one or more strains but unique to P-series or N-series pools, respectively; red starbursts, SNP resulting in a predicted amino acid change. (A) AcrB with predicted recombination points (arrows). (B) Linear protein sequence schematic of AcrA, with corresponding SNP locations shown below and in scale.

