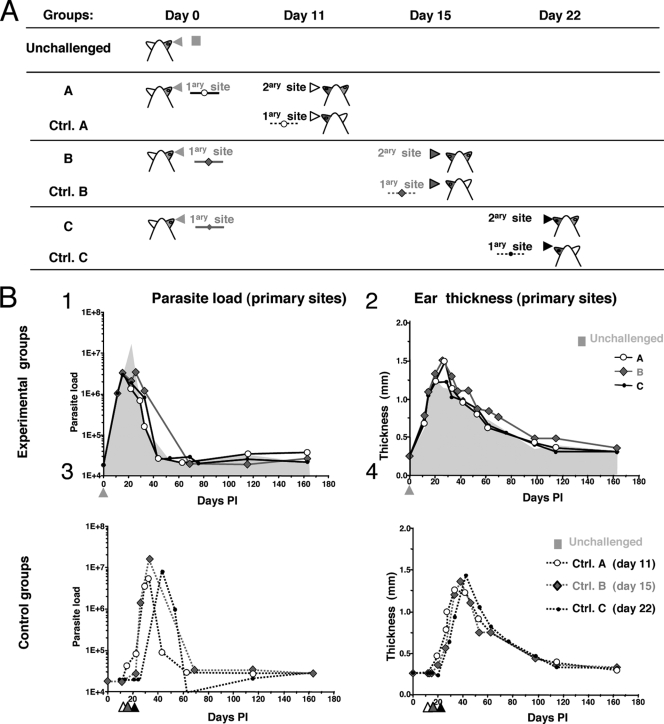
FIG. 2.
Definition of experimental and control groups and features monitored at primary sites of L. major inoculation. (A) Definition of experimental groups (A to C) and control groups (Ctrl. A to Ctrl. C) (n = 12 mice per group). C57BL/6 mice were first inoculated with 104 luciferase-expressing NIH 173 metacyclic promastigotes in the ear dermis (primary site) and were then reinoculated with 104 luciferase-expressing NIH 173 metacyclic promastigotes in the dermis of the contralateral ear (secondary site) at day 11 p.p.i. (group A), 15 p.p.i. (group B), or 22 p.p.i. (group C). For the control groups, naïve mice received 104 luciferase-expressing NIH 173 metacyclic promastigotes in the dermis on day 11 p.p.i. (Ctrl A), 15 p.p.i. (Ctrl B), or 22 p.p.i. (Ctrl C). Longitudinal follow-up of the parasitic load and the ear thickness was done for up to 163 days p.p.i. (B) Dots represent the median value obtained for each group. Quantification of the parasitic load by determination of the bioluminescence (in photons per second per ear; panels 1 and 3) and ear thickness (in mm; panels 2 and 4) of the primary sites was performed for the experimental groups (panels 1 and 2) and the control groups (panels 3 and 4). The results are depicted as the medians ± standard deviations. Arrowheads indicate the day of parasite inoculation in the unchallenged group and the day of the second inoculation in the experimental and the control groups. The values obtained for the unchallenged group are shown in the gray areas indicated in panels 1 and 2.

