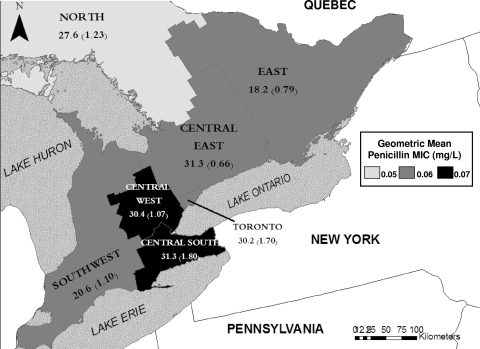
FIG. 3.
N. meningitidis isolates with intermediate susceptibility to penicillin by Ontario health region. The map shows six southern Ontario health regions and the southernmost portion of a northern health region as shaded areas. The highest geometric mean penicillin MIC is seen in the central west and central south regions at the western extreme of Lake Ontario. The lowest penicillin MIC is seen in the northern region. Numbers denote the proportion of isolates from each region with intermediate susceptibility to penicillin, and numbers in parentheses denote the number of cases of IMD with intermediate susceptibility per million residents per year.

