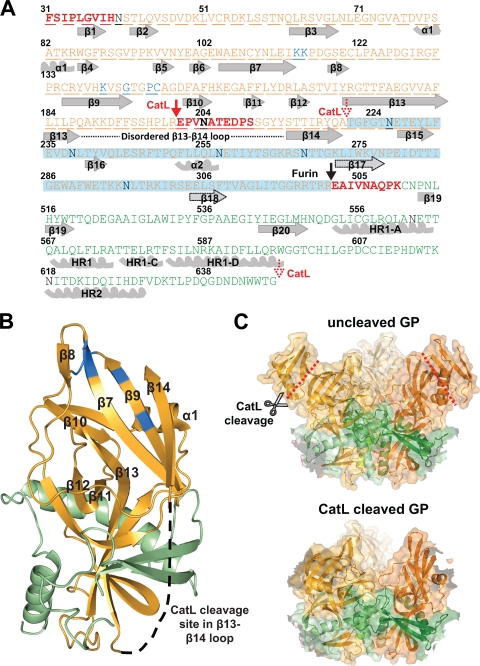
FIG. 3.
Mapping and modeling of the ZEBOV-GP CatL cleavage site. (A) Schematic of the EBOV GP sequence aligned with secondary structure features. Alpha-helices and beta-strands are numbered and shown in gray (or outlined in a black dotted line for tentative assignment), and the three N termini at resides 31, 201, and 501 are shown in boldface and red. The N-terminal CatL cleavage site in GP1 is shown at residue 201 (red arrow) and the C-terminal site approximately at residue 222 (dotted red arrow), while the C-terminal of GP2 extends to residue 647 (dotted red arrow). The disordered loop between beta-strands 13 and 14 is shown by a black dotted line. The furin cleavage site is depicted by a black arrow at residue 502. GP1 (orange), GP2 (green), N-glycans (black), and residues important for entry (blue) are labeled as in Fig. 2. The region deleted upon CatL cleavage, including the entire MUC domain, is highlighted in blue. (B) The modeled CatL-cleaved monomer structure is shown based on the recently reported structure and Protein Data Bank file number 3CSY (10). Beta-strands and alpha-helices of the head region are numbered, with GP1 and GP2 residues shown in orange and green, respectively. The first GP1 CatL cleavage site is shown in the disordered loop between β13 and β14, with the latter beta-strand being covalently associated to beta-strand 9. This model assumes there is no conformational change following processing by CatL. (C) The EBOV GP trimer structure (upper panel) (10) is shown by ribbons with a transparent surface representation and red lines depicting the CatL cleavage site in the β13-14 loop. As reported in reference 10, GP1 (shades of orange) forms a chalice, while GP2 (shades of green) girdles the base of GP1. The modeled CatL-cleaved EBOV trimer structure (lower panel) (based on reference 10 and using the same color scheme as the upper panel) shows the removal of the glycan cap while maintaining the GP2 and the intact fusion peptide, and it also assumes that no conformational change results from the cleavage process. All graphic representations were produced with PyMOL.

