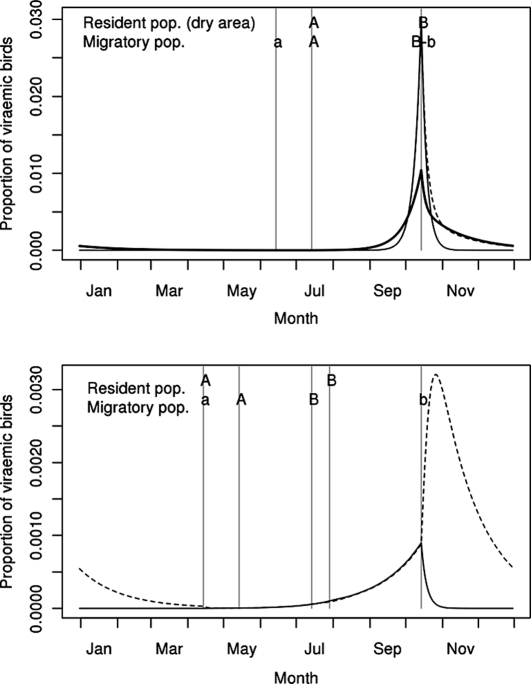
Figure 4.
Predicted annual variations of the proportion of viraemic birds in the resident populations of Africa (top, thick line: wet area, thin line: dry area) and Europe (bottom, thin line), and in the migratory populations (dashed lines, top: short distance African migratory population, bottom: long distance migratory population). A–B: Hatching periods for the bird populations living in Africa (top, not indicated for the resident population of the wet area for which reproduction is not seasonal) and Europe (bottom). a–b: Presence of the migratory populations on their breeding sites in Africa (top) and in Europe (bottom).

