
Figure 4.
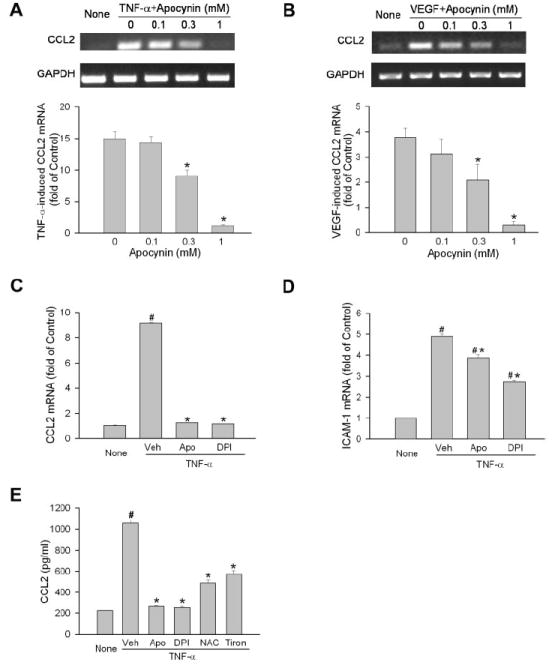
Involvement of NAD(P)H oxidase/ROS pathway in CCL2 production in human ECs. (A) Human ECs were pretreated with apocynin at the concentrations indicated for 0.5 hour. Cells were then stimulated with TNF-α (0.03 ng/mL) for 2 hours. CCL2 mRNA was determined by semiquantitative PCR (n = 3). CCL2 level in cells without treatment (None) is used as reference. *P < 0.05 compared with apocynin at 0 mM. (B) Human ECs were treated and analyzed as in (A) except that VEGF (30 ng/mL) was used as agonist (n = 3). (C) Human ECs were pretreated with apocynin (1 mM), DPI (20 μM), or vehicle for 0.5 hour. Cells were then simulated with TNF-α (0.03 ng/mL) for 2 hours. CCL2 mRNA was measured by quantitative PCR. CCL2 level in cells without treatment (None) is used as reference (n = 4). #P < 0.05 compared with None. *P < 0.05 compared with vehicle. (D) Cells were treated as in (C), and ICAM-1 expression was measured (n = 4). (E) Human ECs were pretreated with vehicle, apocynin (1 mM), DPI (20 μM), N-acetyl-l-cysteine (10 mM), or Tiron (10 mM) for 0.5 hour and were then simulated with TNF-α (0.03 ng/mL) for 3 hours. Culture media were collected, and CCL2 levels were determined by ELISA (n = 4). #P < 0.05 compared with None. *P < 0.05 compared with vehicle.