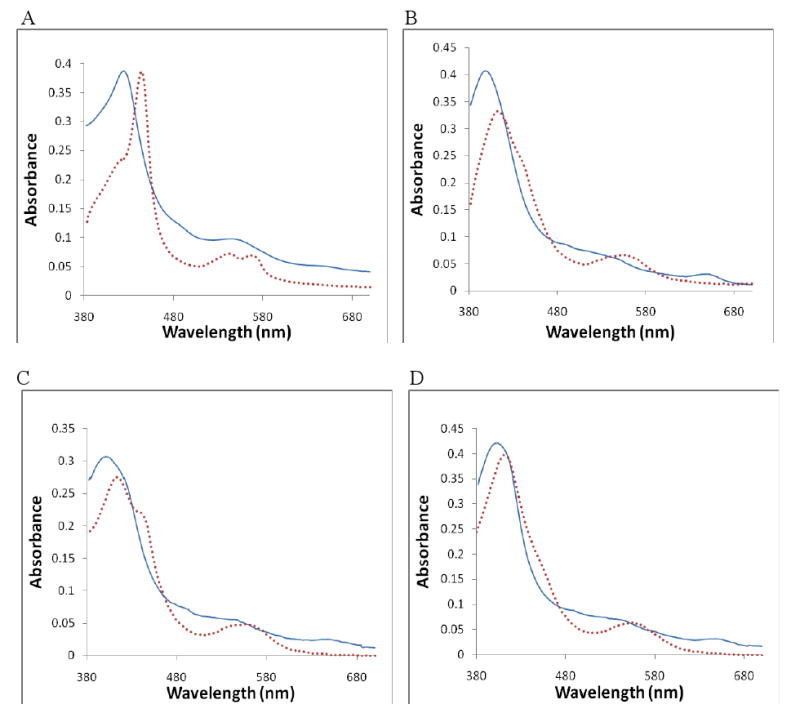
Figure 2.

Absolute absorption spectra in the ferric and ferrous oxidation states for Panel A) 3 -nNOS; B) 4 -nNOS; C) 8 -nNOS; and D) H4B -nNOS with no inhibitor present as a control. In each panel, the solid line represents the ferric spectrum, and the dotted line represents the ferrous spectrum.
