Figure 1.
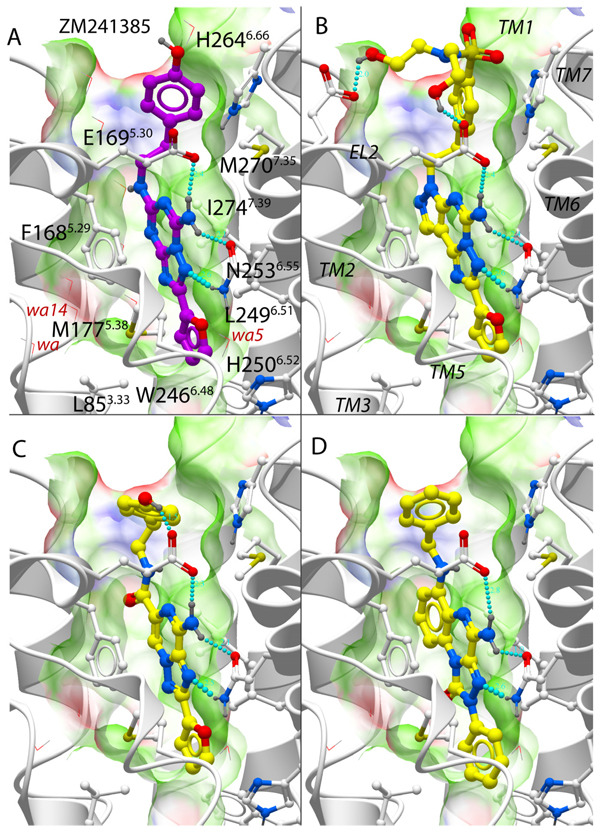
Binding of known antagonists into human adenosine A2A receptor models. (A) Co-crystal structure with compounds 1 as in PDB entry 3EML35, ligand carbons are shown in magenta color. (B–D) Optimized model 3EMLW3_opt with 3 top scoring compounds from the benchmark set (B) mantri(n)27, (C) mantri(f) 27 (D) mantri(k)27. For all ligands, the A2A binding pocket is shown as transparent skin colored by properties (green: hydrophobic, red: acceptor, blue: donor of H-bond). Water molecules are shown by thin red lines and with labels for the three structured waters with lowest B-factors. Hydrogen bonds are shown by cyan spheres.

