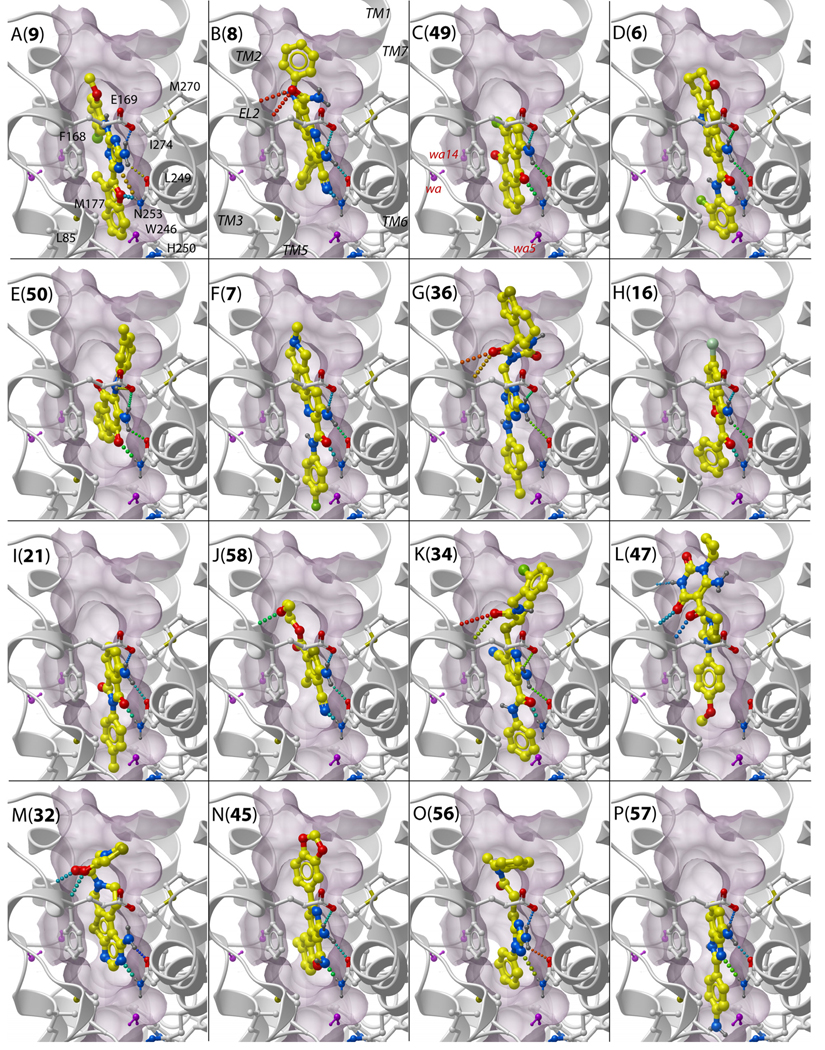
Figure 3.
Examples of binding poses in the 3EMLW3_opt receptor model for predicted A2AAR candidate ligands representing 16 different chemical clusters. The letters (A to P) show cluster names, the numbers in brackets indicate compound IDs. Labels for the (i) contact side chains, (ii) TM domains and (iii) structured waters of the receptor model are shown in panels A to C. Side chains of the receptor are shown by sticks with white carbon atoms, in ligands the carbon atoms are colored yellow. Structured water molecules in the model are shown by purple sticks. Hydrogen bonds are colored according to their predicted strength, from blue (strongest) to red (weakest). The binding pocket surface is shown by purple skin, which is clipped in foreground for better view.

