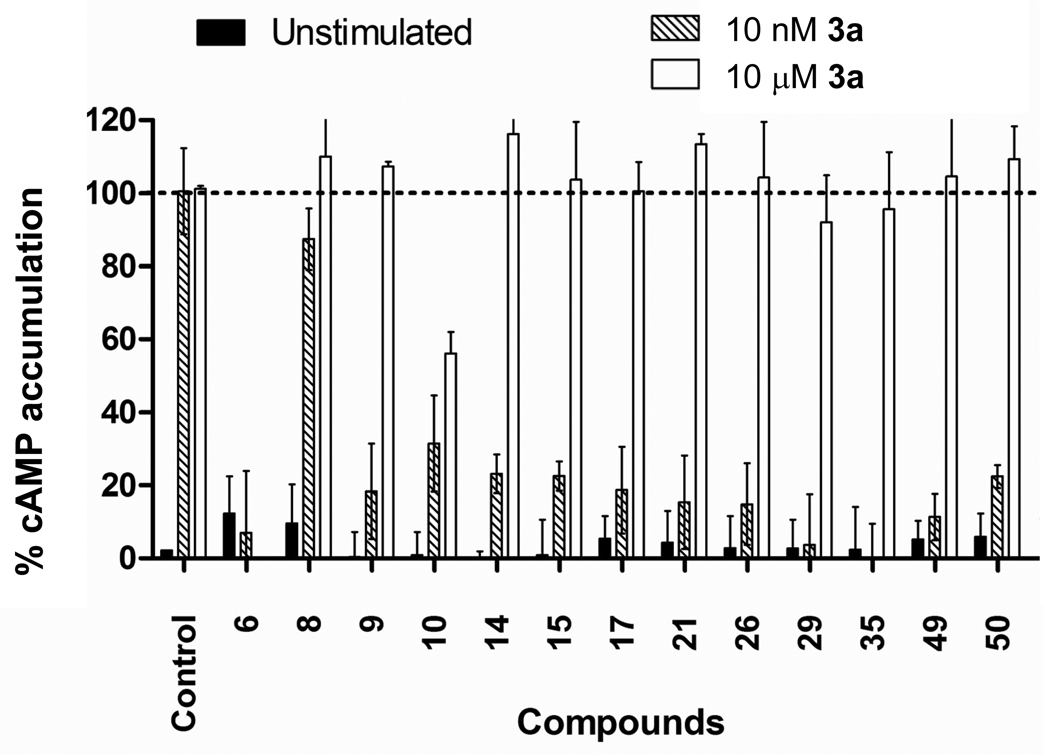
Figure 5.
Inhibition of agonist-induced cAMP production by the A2AAR hit compounds. Activity is measured at 10 µM concentration of the compounds, as compared to no compound in the control. Data is normalized where 0 % represents the unstimulated condition (black bars) and 100 % represents the accumulation of intracellular cAMP observed for stimulation with compound 3a at 10 nM or 10 µM concentrations (shaded and open bars respectively).

