
Table1.
Representative hits clustered by different chemotypes, with their A2AAR binding characteristics and predicted ICM Scores. Clusters are named as in Figure 3. The last column shows compounds in GLIDA database of ~30,000 GPCR ligands43 with highest chemical similarity to the identified hits.
| ID | Cluster | Chemical Structure | Ki µM | 95% confidence interval |
Maxa Inhibition % |
LEb | ICM Scorec |
Closest Analog in GLIDA (Tanimoto Distance) |
|---|---|---|---|---|---|---|---|---|
| 9 | A | 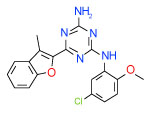 |
0.032 | (0.023–0.043) | 80 | 0.38 | −36.3 | 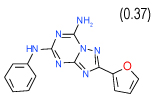 |
| 8 | B | 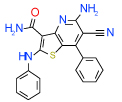 |
0.63 | (0.12–3.3) | 54 | 0.3 | −34.3 | 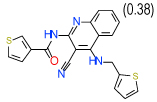 |
| 15 | B | 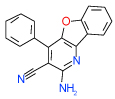 |
0.06 | 0.0082–0.45) | 91 | 0.45 | −32.4 | 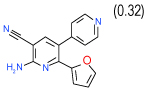 |
| 49 | C | 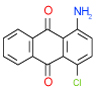 |
0.25 | (0.21–0.3) | 100 | 0.5 | −36.4 | 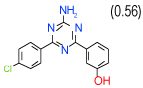 |
| 35 | C | 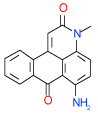 |
0.64 | (0.43–0.94) | 96 | 0.4 | −39.1 | 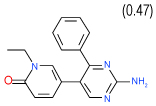 |
| 29 | C | 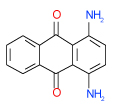 |
0.32 | (0.25–0.4) | 88 | 0.49 | −37.5 |  |
| 26 | C | 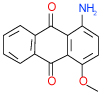 |
0.53 | (0.29–0.98) | 90 | 0.45 | −37.8 | 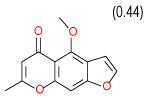 |
| 6 | D | 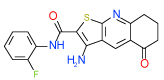 |
0.3 | (0.15–0.62) | 70 | 0.35 | −35 | 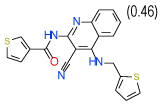 |
| 14 | D |  |
1 | (0.73–1.4) | 78 | 0.35 | −34.8 | 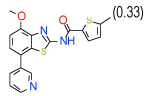 |
| 10 | D | 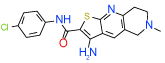 |
2.7 | (1.4–5.3) | 92 | 0.3 | −35.6 | 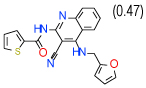 |
| 50 | E | 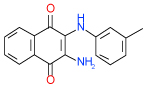 |
0.8 | (0.44–1.5) | 78 | 0.39 | −37.8 | 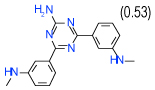 |
| 17 | E |  |
0.56 | (0.19–1.6) | 80 | 0.35 | −38.4 |  |
| 21 | I |  |
2.9 | (1.7–5.1) | 66 | 0.4 | −38.5 |  |
a
Maximum Inhibition was achieved at 10 µM concentration for compound 9 and at 32 µM for compound 15. All other compounds showed maximum inhibition at 1 mM.
b
Experimental ligand efficiency, kcal/mol , calculated as ligand binding energy per heavy atom.
c
Predicted ICM binding score, kJ/mol