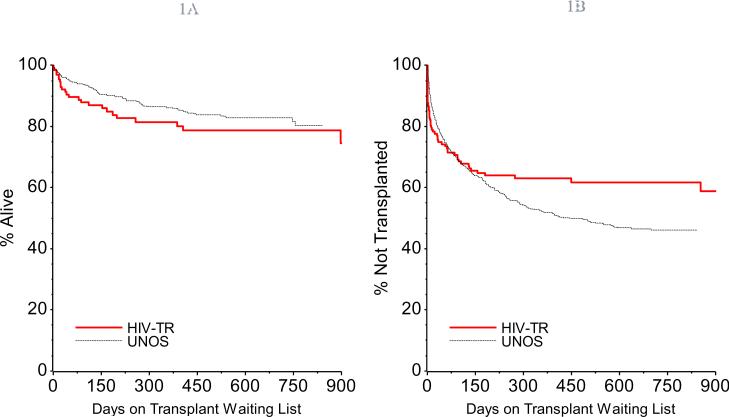
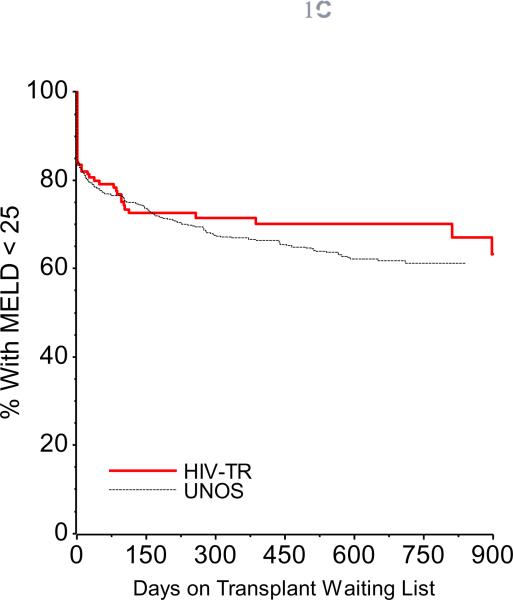
Figure 1.
Figure 1a. Time to Death in HIV(+) Transplant Candidates. This Kaplan Meier plot shows that time to death is similar in HIV(+) and HIV(−) transplant candidates., p = 0.18.
Figure 1b. Time to Transplantation in HIV(+) Transplant Candidates. This Kaplan Meier plot shows time to transplantation is similar in HIV(+) and HIV(−) transplant candidates, p = 0.13.
Figure 1c. Time to MELD ≥ 25 in HIV(+) Transplant Candidates. This Kaplan Meier plot shows the time to elevation of MELD to ≥ 25 is similar in HIV(+) and HIV(−) transplant candidates, p = 0.13.


