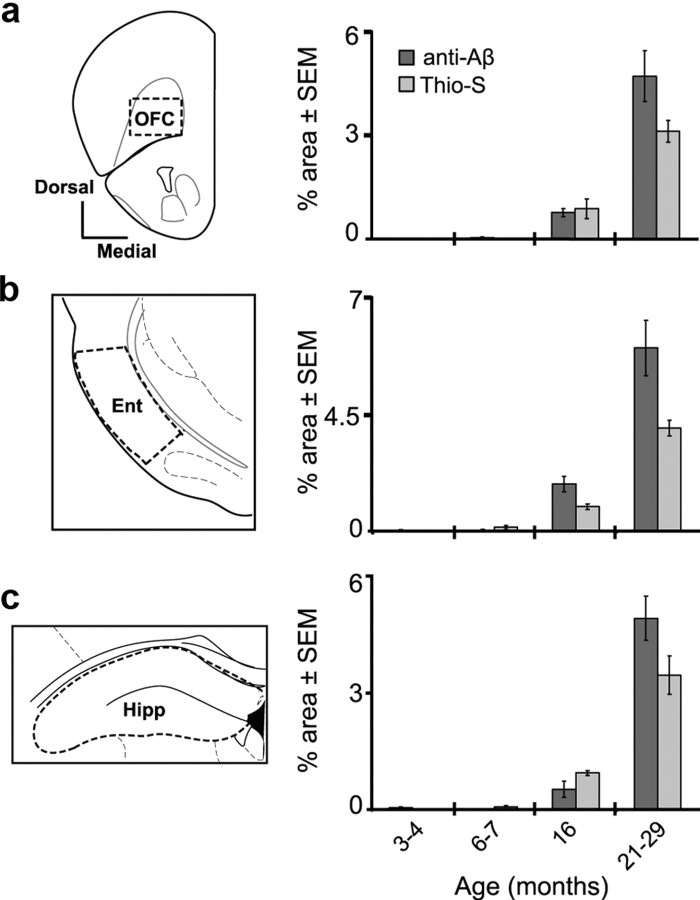
Figure 4.
Aβ deposition within higher-order olfactory regions. Coronal plate and quantification of Aβ deposition [percentage area, Thioflavin-S (Thio-S) and anti-Aβ (4G8)] in the OFC (a), Ent (b), and Hipp (c). The dashed regions within each coronal plate indicate approximate areas used for quantification. Error bars indicate SEM.

