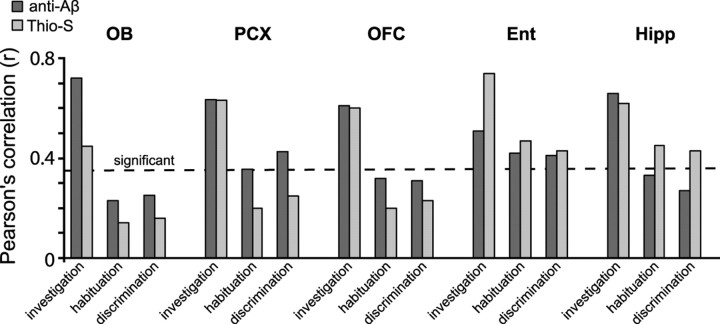
Figure 5.
Olfactory behaviors correlate with the spatiotemporal deposition of Aβ. Pearson's correlation values (r) between Aβ deposition (percentage area) within the OB, PCX, OFC, Ent, and Hipp, and group-averaged olfactory scores (investigation time, percentage habituation, cross-habituation index) (Fig. 1c, black circles) in Tg2576 mice. Percentage habituation, The percentage difference between investigation duration in the first odor trial compared with the fourth. OB data, Average of plaque area in granule cell layer. PCX data, Average of aPCX and pPCX, all cell layers. The dashed line indicates threshold of statistical significance (r ≥ 0.36) based on the population size within each bar (n = 22 mice).

