
Fig 1.
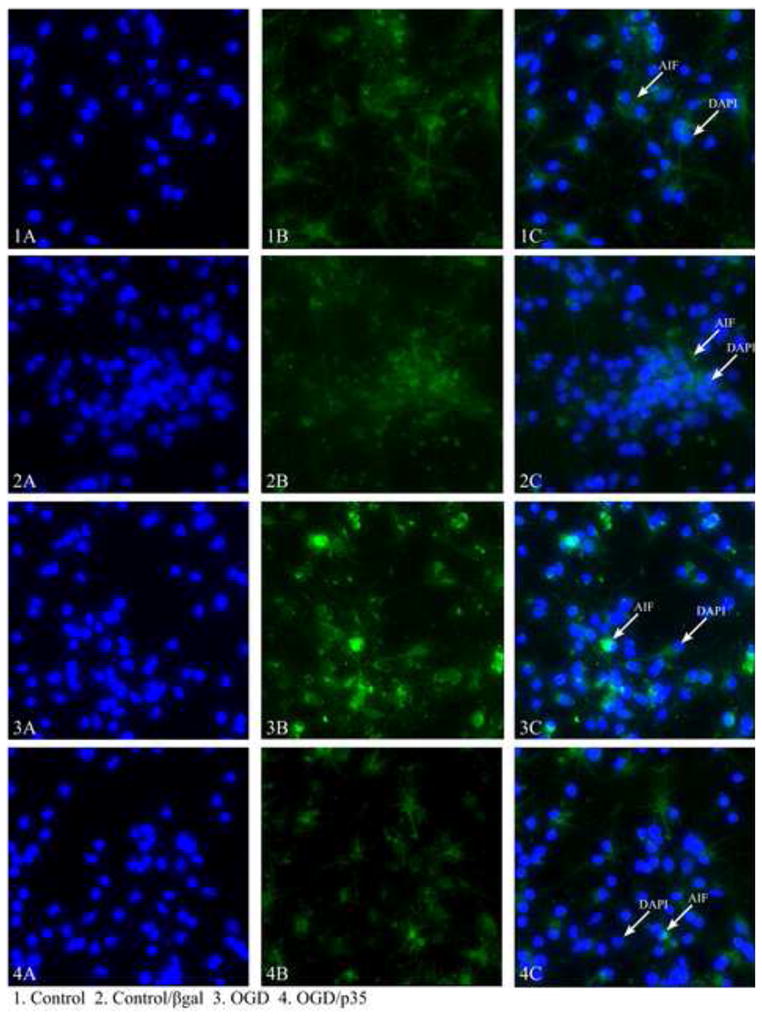
Representative images of AIF staining in cortical cultures showing the differences in the amount of fluorescence between control and experimental cells. 1A) DAPi staining of the nuclei of control cells 1B) AIF staining of control cells, not treated with OGD 1C) overlaid staining of AIF and DAPi, 2A) DAPi staining of the nuclei of cells treated with βgal without OGD 2B) AIF staining of βgal treated cells 2C) Overlaid staining of AIF and DAPi 3A) DAPi staining of the nuclei of OGD treated cells 3B) AIF staining of OGD treated cells 3C) overlaid staining of AIF and DAPi, 4A) DAPi staining of OGD and p35 treated cells 4B) AIF staining of OGD and p35 treated cell 4C) Overlaid staining of AIF and DAPi.