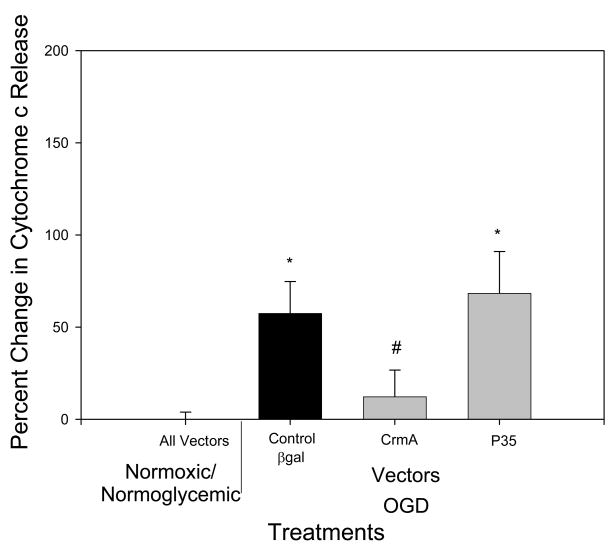
Fig 4.
Effect of overexpression of crmA or p35 on cytochrome c release. There was no significant difference between normoxic/normoglycemic wells treated with the different vectors, so they are represented as one point on the graph and all set to zero (All vectors). In control cultures, OGD increased cyt c release 50% (relative to normoxic/normoglycemic cultures expressing reporter gene); crmA, but not p35, blocked such cyt c release (relative to normoxic/normoglycemic cultures overexpressing crmA or p35). n=16–20
* p=0.05 as compared to normoxic/normoglycemic cells treated with βgal
# p<0.05 as compared to βgal/OGD.

