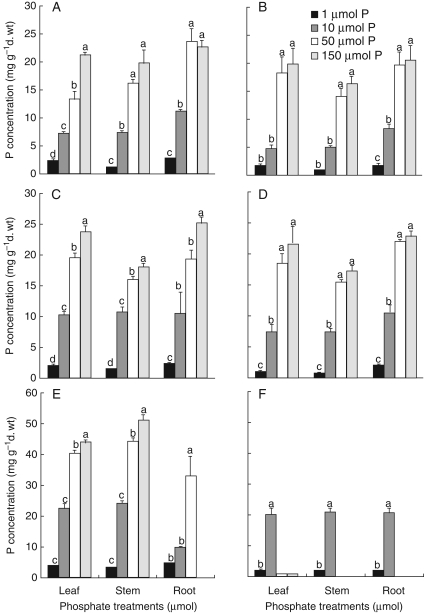
Fig. 4.
Effects of phosphate concentration in the root environment on P concentration in Lupinus species during 54 d of hydroponics culture. L. albus day 39 (A), L. albus day 54 (B), L. atlanticus day 39 (C), L. atlanticus day 54 (D), L. micranthus day 39 (E), L. micranthus day 54 (F). Treatment means marked with the same lower-case letter are not significantly different within each group using a one-way ANOVA for each harvest followed by Duncan's multiple test (P < 0·05).

