Fig. 2.
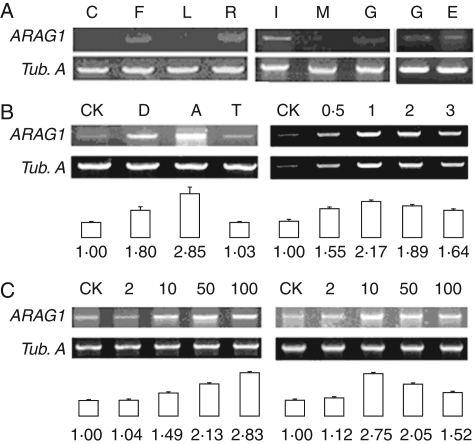
mRNA accumulation pattern of ARAG1 in different tissues or at different development stages examined by semi-quantitative RT-PCR in triplicate. The statistical data presented are the mean ± s.d. Tubulin A (Tub. A) transcripts were used as constitutive controls. The expression intensity was analysed by 2DE Image Master software (2002.01). (A) Expression patterns of ARAG1 transcript in coleoptiles (C), inflorescences with male meiocytes at meiotic stage (F), leaves (L), roots (R), immature embryos (I), germinating embryos (G), endosperms of germinating seeds (E) and mature embryos (M). (B) Accumulation of ARAG1 transcripts in roots subjected to 0·5 h of drought (D), 100 µm ABA (A), and 4 °C low temperature (T), or with 100 µm ABA treatment for 0·5, 1, 2, 3 h, respectively. (C) Accumulation of ARAG1 transcripts in roots after treatment with 2 µm (2), 10 µm (10), 50 µm (50), 100 µm (100) ABA for 30 min (left) or for 60 min (right).

