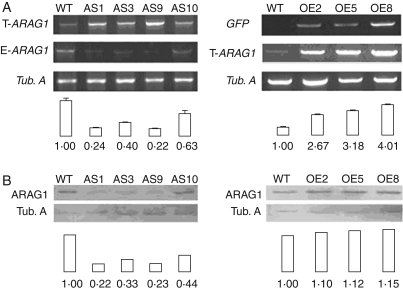
Fig. 3.
Expression of ARAG1 in transgenic rice. WT, wild type; AS1, AS9 and AS10, antisense lines 1, 3 and 9, respectively; OE2, OE5 and OE8, over-expression lines 2, 5 and 8, respectively. Left, transgenic AS line; right, transgenic OE line. (A) Semi-quantitative RT-PCR analyses of ARAG1 expression in rice transgenic lines. Tubulin A (Tub. A) transcripts were used as constitutive controls. Quantification of mRNA levels (ratios of normalized data for transgenic lines vs WT) is listed below the figure. The endogenous ARAG1 transcripts (E-ARAG1) were amplified by primers of P3 and P7; the total transcripts of ARAG1 (T-ARAG1) were amplified by primers of P3 and P4; GFP expression level (GFP) represents the over-expression level of ARAG1. (B) Western blot of ARAG1 expression in wild-type and transgenic rice lines.

