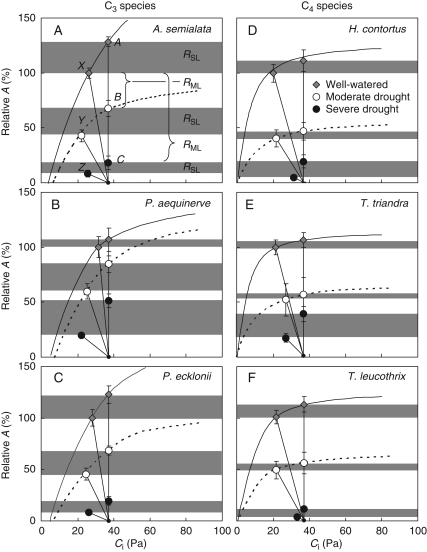
Fig. 5.
A/Ci responses for C3 (A–C) and C4 (D–F) Panicoid grasses during three watering treatments: well-watered, moderate drought and severe drought, as indicated. Photosynthetic rates are expressed as a percentage of the rates measured at Ca = 38 Pa for well-watered plants (X). During the severe drought treatment, photosynthetic rates were only measured at a Ca of 38 Pa, or at a Ca corresponding to a Ci of 38 Pa. Also shown are the average photosynthetic rates at an atmospheric CO2 concentration (Ca) of 38 Pa assuming no stomatal limitation (i.e. Ca = Ci = 38 Pa; A, B and C) and supply functions representing the limitation on A imposed by CO2 diffusion through the stomata (X, Y and Z) for plants treated with three levels of drought. Each of these functions has a slope, which is set by the stomatal conductance and intercepts the Ci axis at Ca. n ≥ 4 and vertical bars represent standard errors. Shading indicates relative stomatal limitations (RSL) and brackets the relative metabolic limitations (RML).

